Validation Data Sets
Choice of Data Sources
The majority of the work done so for the the SEP Model Validation effort has focused on GOES integral fluxes, which are the data streams monitored at the NOAA Space Weather Prediction Center (SWPC) for forecasting and NASA Space Radiation Analysis Group (SRAG) for human space operations.
We recognize that the GOES data sets have certain drawbacks. Indeed, the various experiments and proton data sets available all have strengths and weaknesses. We are putting effort into understanding the data sets and determining the best use of each for validation - both from an operational and scientific perspective.
A document titled Proton and Ion Data Sets that are Typically Used to Measure SEPs: Description and Caveats has been drafted describing the strengths and drawbacks of each proton experiment with recommendations about their best use in validation. We invite the community to review this document and provide feedback/comments.
Access the google doc here.
Calculation of SEP Event Quantities for this Effort
The quantities shown throughout the site and in the downloadable files were calculated event-by-event using the OpSEP code written by Kathryn Whitman for this effort. The code is publicly available at: https://github.com/ktindiana/operational-sep
- This code has a few "native" data sets, including GOES-08 to GOES-15, SOHO/EPHIN, and SEPEM RSDv2.0. The user may apply different recalibrated effective energies to GOES differential channels as reported in the literature by Sandberg et al. 2014 and Bruno 2017.
- Users may also input their own data sets of fluxes with time. In this way, model time profiles can be assessed in exactly the same way as observed time profiles.
- Differential fluxes are converted to integral fluxes within the code. Gaps in time (bad flux values below 0) are interpolated in time to get a better estimate of event fluence.
- Users may specify dates that represent background levels and perform background subtraction.
- The code always applies >10 MeV, 10 pfu and >100 MeV, 1 pfu thresholds to define SEP events. Users may specify their own thresholds which may be applied to integral or differential channels.
- All values in the code are calculated in an automated way to ensure reproducibility from one user to the next.
The code calculates the following values and outputs them in both csv format and json files that mirror the json files used by CCMC's SEP Scoreboard for model forecasts:
- >10 MeV, 10 pfu and >100 MeV, 1 pfu threshold crossings
- Onset peak flux and time (identified by an automated algorithm that works fairly well, but perhaps may be improved)
- Maximum peak flux and time
- Duration
- Event fluence spectrum
Examples of output produced by operational_sep_quantities.py
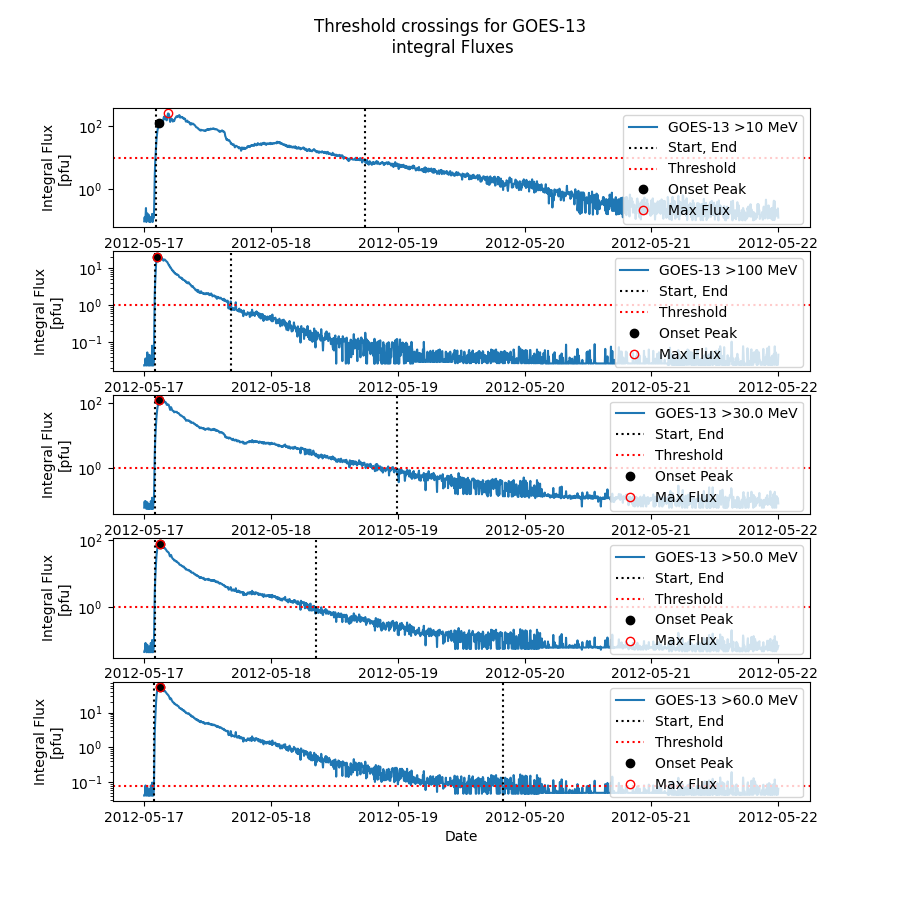
2012-05-17 GOES-13 Integral Fluxes
GOES integral fluxes are tested again operational and other thresholds. In this case:
- >10 MeV, 10 pfu
- >100 MeV, 1pfu
- >30 MeV, 1 pfu
- >50 MeV, 1 pfu
- >60 MeV, 0.079 pfu
Start and end times, the onset peak and time, and the maximum flux value and time are identified. The values shared throughout this website correspond to the case described here.
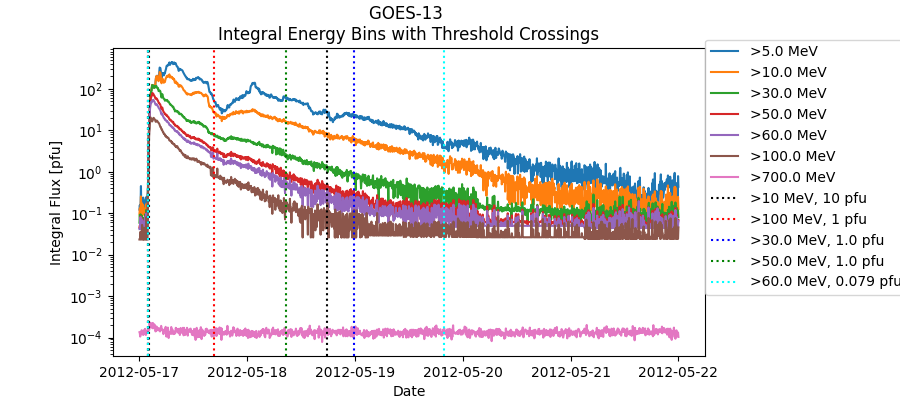
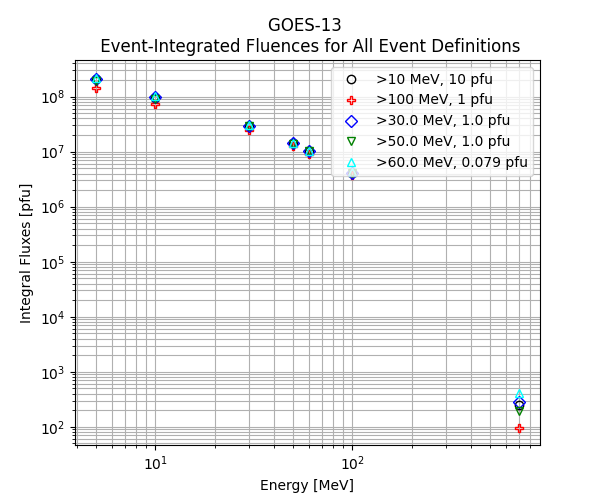
Because the original input data set consisted of integral fluxes, the integral fluence spectrum is calculated for each threshold definition. In other words, each data point in the plot below shows the fluence for the GOES integral channels (>5, >10, >30, >50, >60, >100, >700 MeV).
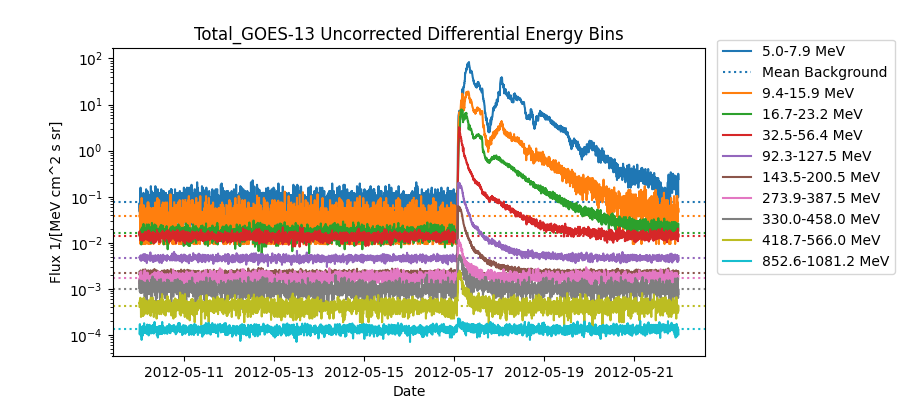
2012-05-17 GOES-13 Uncorrected Differential Fluxes with Sandberg et al. and Bruno 2017 Effective Energies Applied
Users may opt to choose GOES fluxes and apply energy calibrations that have been reported in the literature. The plot below shows the total flux for a time period containing an appropriate background prior to the SEP event and the SEP event flux for GOES-13 uncorrected differential fluxes. The energies in the legend correspond to the Sandberg et al. 2014 effective energies for EPEAD and the Bruno 2017 effective energies for EPEAD channels above 80 MeV and HEPAD.
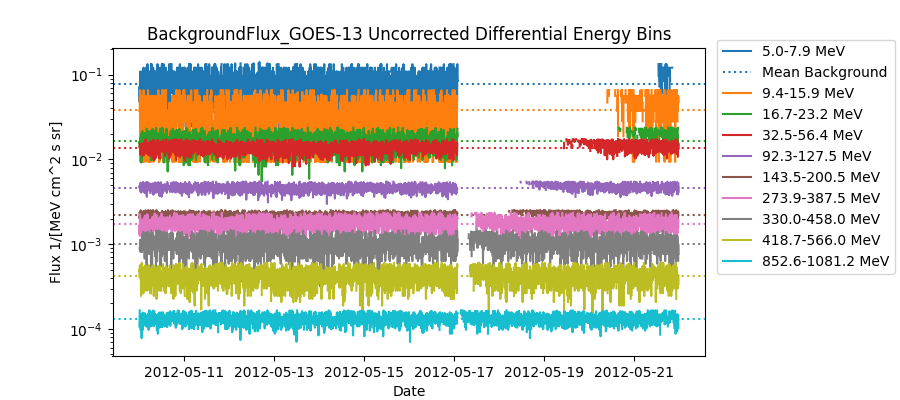
A background period is identified by the user (2012-05-10 to 2012-05-16) and a mean background level and expected amount of variation (sigma) is calculated. All fluxes below mean + n*sigma (in this case n = 2.0) are identified as background, shown in the plot below. The mean background levels are identified as dashed lines.
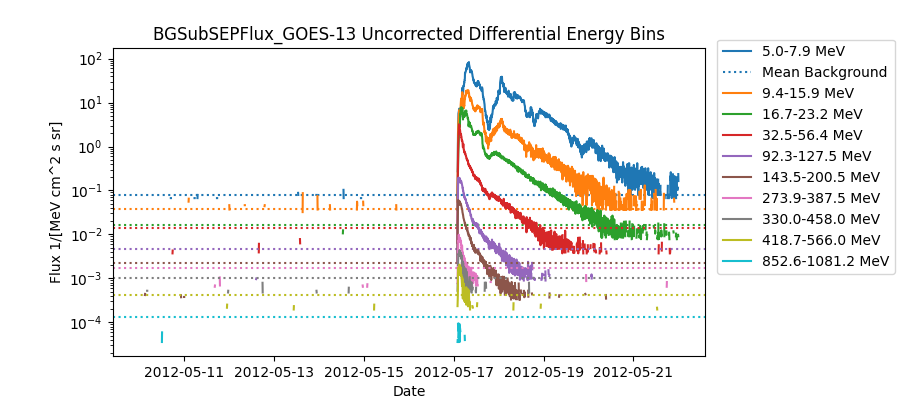
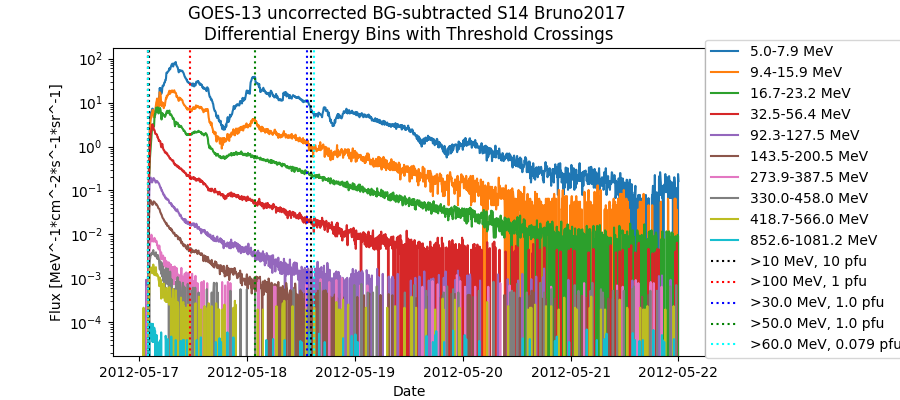
All values above the mean + n*sigma (in this case n = 2.0) are identified as elevated SEP fluxes and the mean background is subtracted from each channel. The plot below shows the SEP background-subtracted fluxes with the mean background levels shown as dashed lines.
The background-subtracted differential fluxes are converted to integral fluxes and checked against the operational and other thresholds. Start and end times, the onset peak and the maximum flux are identified (below left). The background-subtracted differential fluxes are plotted with the start and stop times for each threshold definition (below right).
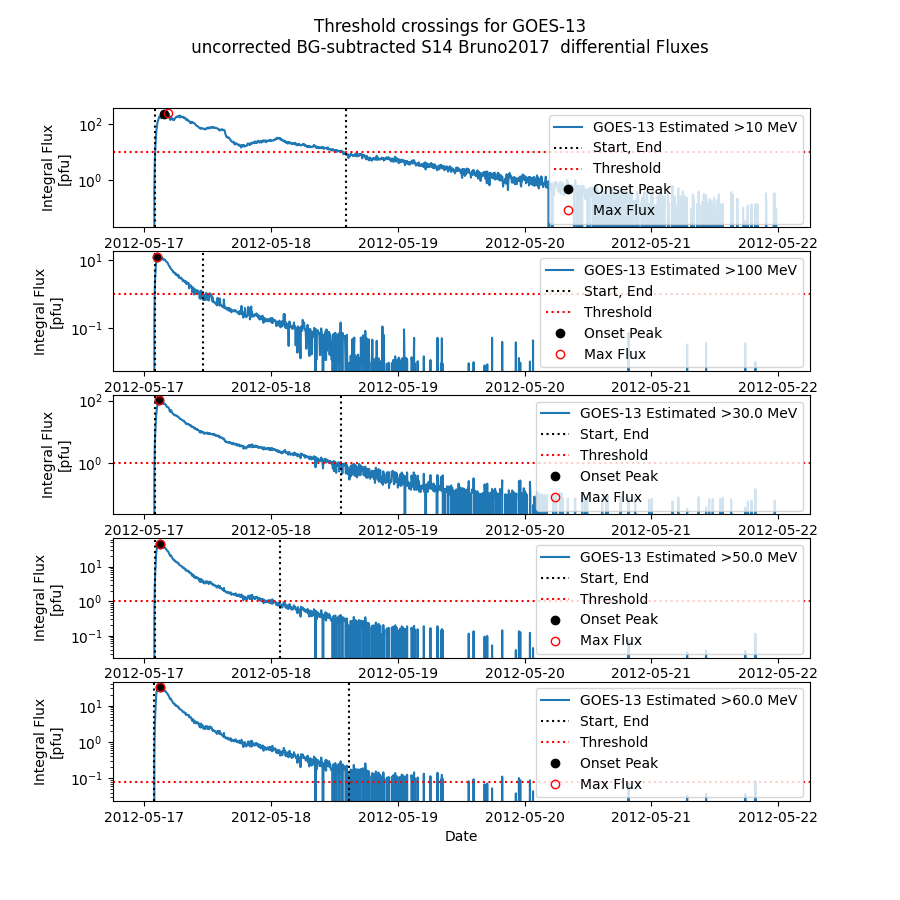
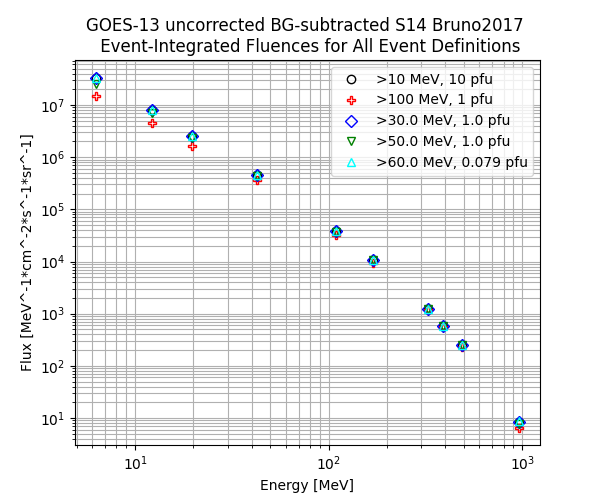
Because the original input data set was differential fluxes, the background-subtracted differential fluence spectrum is calculated between the start and end times for each threshold (below).
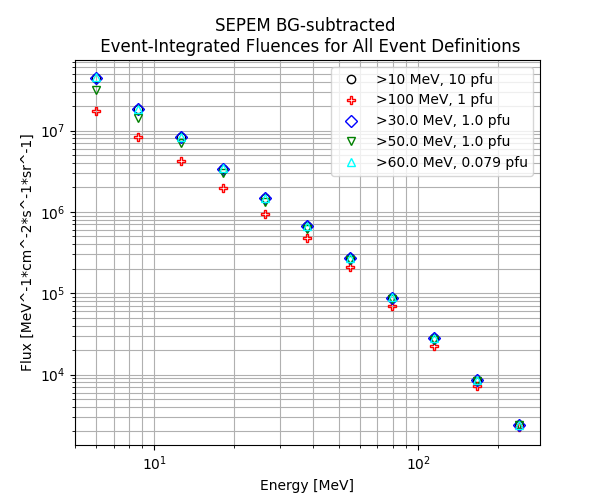
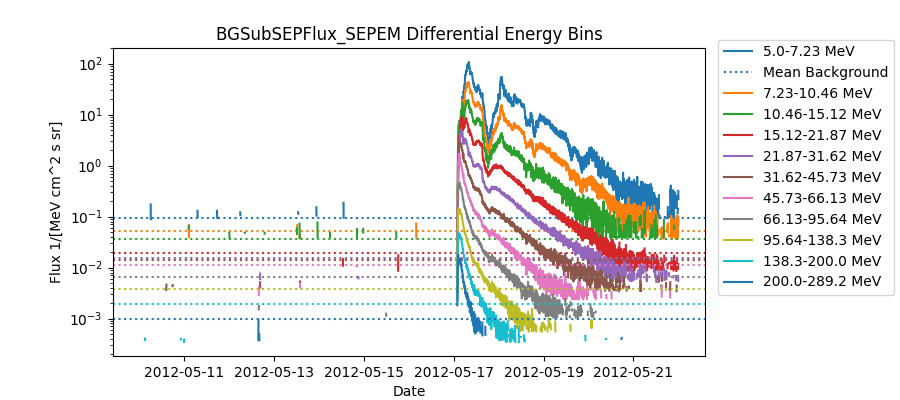
2012-05-17 SEPEM RDSv2.0 Background-Subtracted Differential Fluxes
The SEPEM RDSv2.0 data set is a data set derived from GOES experiments that have been cross-calibrated to IMP-8 fluxes. It is a long baseline data set that extends from 1974 - 2015 and is provided through the sepem.eu website. If the user downloads this data set, operational_sep_quantities.py can use it to calculate validation quantities. The plot below shows the total flux in the SEPEM data set for a time period containing an appropriate background prior to the SEP event and the SEP event flux.
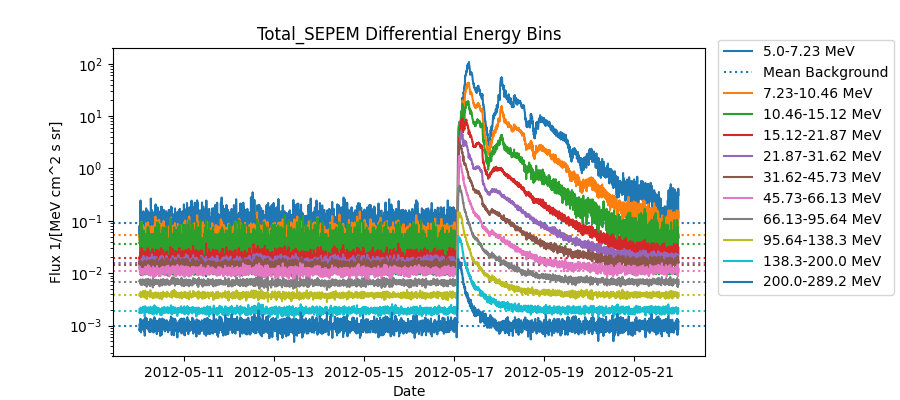
A background period is identified by the user (2012-05-10 to 2012-05-16) and a mean background level and expected amount of variation (sigma) is calculated. All fluxes below mean + n*sigma (in this case n = 2.0) are identified as background, shown in the plot below. The mean background levels are identified as dashed lines.
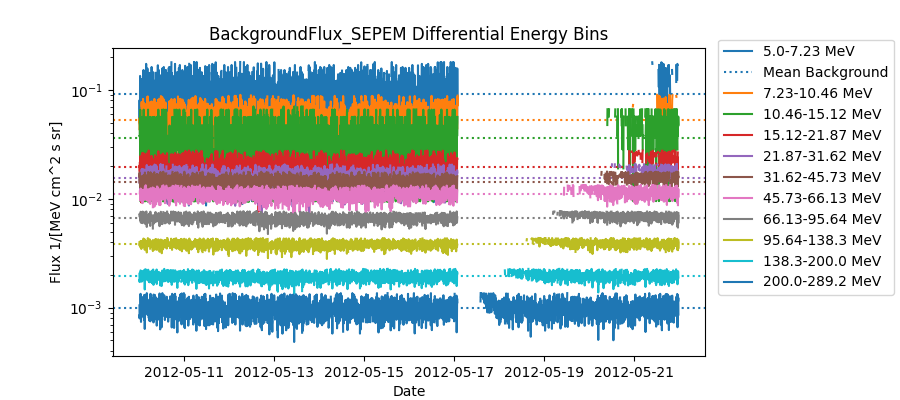
All values above the mean + n*sigma (in this case n = 2.0) are identified as elevated SEP fluxes and the mean background is subtracted from each channel. The plot below shows the SEP background-subtracted fluxes with the mean background levels shown as dashed lines.
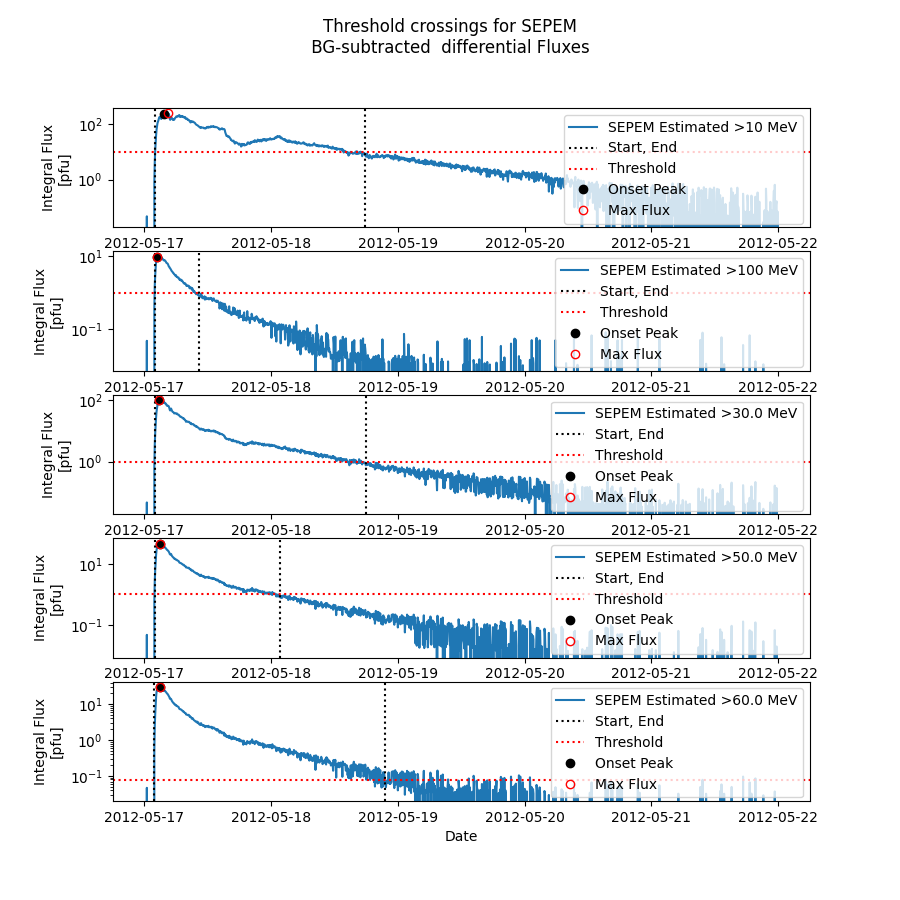
The background-subtracted differential fluxes are converted to integral fluxes and checked against the operational and other thresholds. Note that the SEPEM data set only goes up to 289 MeV, so the >100 MeV fluxes are likely underestimated. Start and end times, the onset peak and the maximum flux are identified (below left). The background-subtracted differential fluxes are plotted with the start and stop times for each threshold definition (below right).

Because the original input data set was differential fluxes, the background-subtracted differential fluence spectrum is calculated between the start and end times for each threshold (below).