Visualization
Interactive Web Visualization
CCMC-developed interactive Web-based visualization software allows the user to analyze simulation results and to perform scientific research without the need to download Runs-On-Request (ROR) simulation run outputs. Outputs of all ROR runs are archived on the CCMC's data storage systems and are publicly accessible by means of these tools.
When a ROR run is completed, a "view run" page will be made available to users (example of a "view run" page). On the "view run" page, pending the model, under "Output Data" there are various options to view the run output via the interactive web visualization tool (see this example for a TIE-GCM ROR run).
Please refer to the interactive web visualization documentations or contact us with any questions.
Movies-On-Request for ROR runs
The user of CCMC interactive web visualizations can now specify the start and end time of a movie request from the standard visualization interfaces of existing Runs-on-Request (ROR) runs ("run_iono2d.cgi" for 2D ionosphere data of Earth-Magnetosphere model outputs and "run_idl3d.cgi" for 3D data for any model outputs). See this example run.
From the visualization interfaces a request can be sent to a queue and the user will be notified by email once the request is completed. The completion may take only a few minutes to a few hours, depending on the complexity of the data, the length of the movie requested and the position in the Movie-on-Request queue at the time of the request.
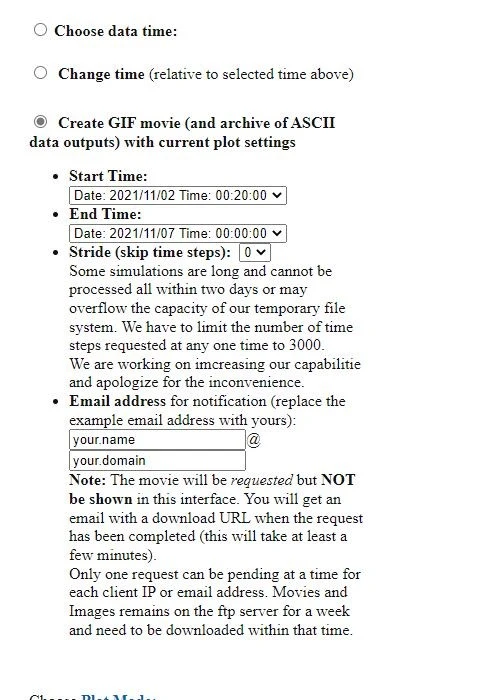
The Movie-on-Request system generates the movie and in addition, images and data files can be requested for each time step. The movie file (animated GIF), individual images, and data output files can be downloaded through the CCMC web server (URLs will be returned by email to the user).
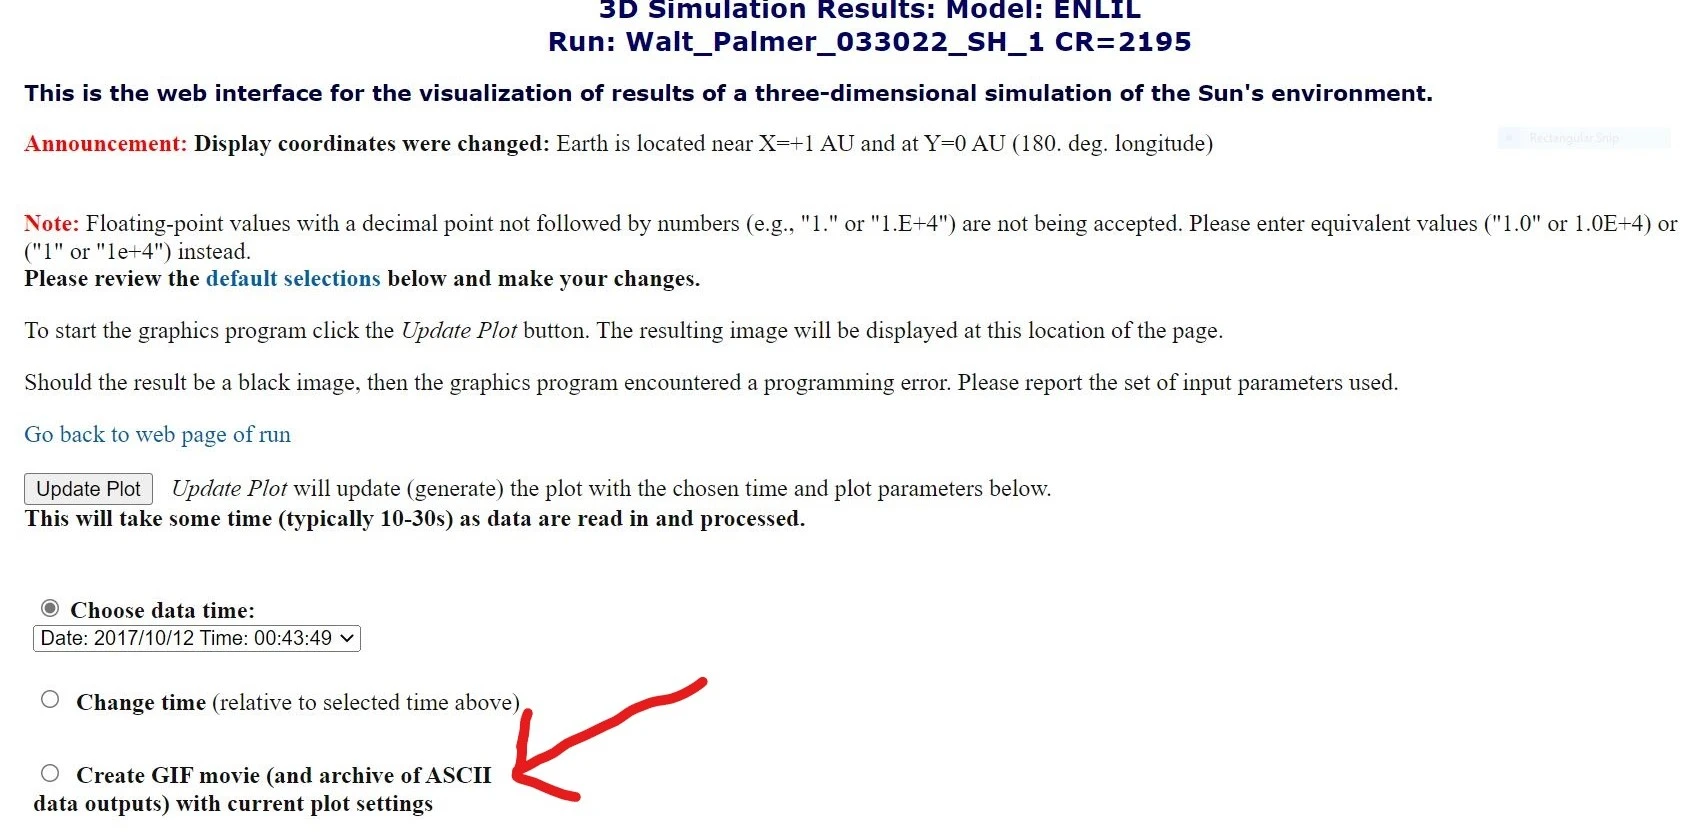
Expand the 'Create GIF movie' option to request movies:
Global Magnetosphere Real Event Analysis for ROR runs (VMR tools)
For Global Magnetosphere Simulation Results on ROR, users can view model-data comparison for real event runs using the Virtual Model Repository (VMR) Tools.
Kamodo
Kamodo is a CCMC tool for access, interpolation, and visualization of space weather models and data in python. Kamodo allows model developers to represent simulation results as mathematical functions which may be manipulated directly by end users. Kamodo handles unit conversion transparently and supports interactive science discovery through jupyter notebooks with minimal coding and is accessible through python.
Kameleon
Kameleon is a software suite that is being developed at the CCMC to address the difficulty in analyzing and disseminating the varying output formats of space weather model data.
CCMC Partnership with OpenSpace
OpenSpace is open source interactive data visualization software designed to visualize the entire known universe and portray our ongoing efforts to investigate the cosmos. The CCMC has partner with the OpenSpace team to provide model outputs to be visualized via the OpenSpace software.
Retired Visualization Tools
Space Weather Explorer 2
Space Weather Explorer 2 (SWX2) is a Java visualization program for space weather simulation data provided by the Community Coordinated Modeling Center. It can be used to view specific timesteps of a run performed by the CCMC, and to interact with the visualization in real-time.
Google Earth Plugin
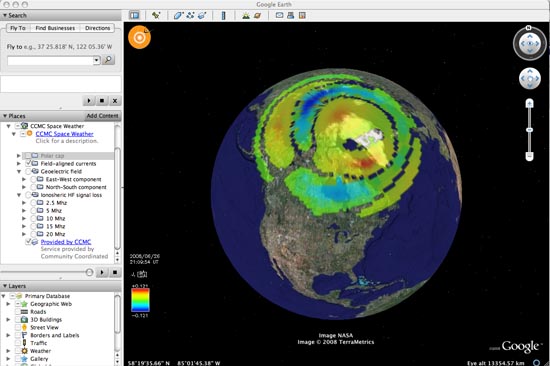
The CCMC's experimental Google Earth space weather service - CCMC Space Weather - provides overlays to various real-time simulation results being generated at CCMC.
To get started, download the main level KML file (right-click > Save As) and open it with your Google Earth application. Click the blue links in the Google Earth window for further information.
Please note that this service is being expanded element by element over time. The new elements will appear automatically to your Google Earth application if the main level KML file is being used. Your comments, corrections and suggestions are always welcome.
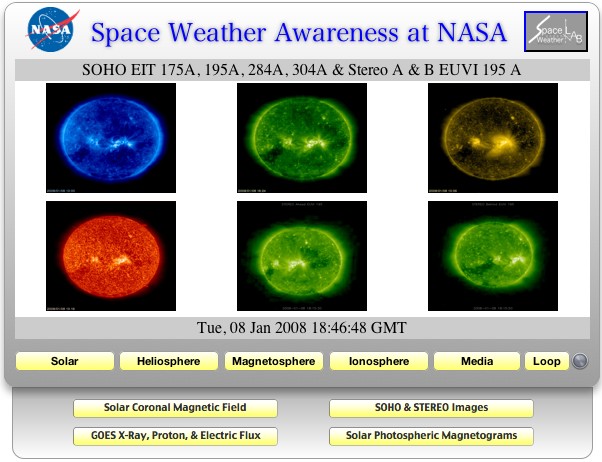
SWAN (Space Weather Awareness at Nasa) Widget
The NASA Space Weather Laboratory SWAN Widget displays images, plots, etc. of both observational data as well as model simulation data. Model Simulation Data is derived from real time simulations at the Community Coordinated Modeling Center at NASA Goddard Space Flight Center. The models are provided by the research community.