
September 4 and 6, 2017
These SEP events are considered together because the >10 MeV proton flux, elevated following a flare and CME on September 4, 2017, was still above threshold when the second event occurred on September 6, 2017. This is indicated by a prompt increase at higher energies that did not however exceed the >100 MeV flux threshold, but it is difficult to separate the events in the >10 MeV flux. For this reason, this time period may be considered as a single event. For models triggered by flares or CMEs, predictions may be made for the two separate events. For models that generate time profiles, this time period may test how a model performs in a complex scenario with multiple CMEs.
September 4, 2017


September 6, 2017


Database links:
https://cdaw.gsfc.nasa.gov/CME_list/UNIVERSAL/2017_09/univ2017_09.html
http://sidc.oma.be/cactus/catalog/LASCO/2_5_0/qkl/2017/09/latestCMEs.html
September 4, 2017
https://kauai.ccmc.gsfc.nasa.gov/DONKI/view/SEP/12984/2
September 6, 2017
https://kauai.ccmc.gsfc.nasa.gov/DONKI/view/SEP/13081/1 (SEP event measured with SOHO COSTEP energy bins)
Flare
| SEP Event Date | Flare Onset Time | Flare Peak Time | Flare End Time | Flare Magnitude | Flare Lat | Flare Lon | Active Region |
| September 4, 2017 | 2017-09-04 20:28:00 | 2017-09-04 20:33:00 | 2017-09-04 20:37:00 | M5.5 | S08 | W16 | 2673 |
| September 6, 2017 | 2017-09-06 11:53:00 | 2017-09-06 12:02:00 | 2017-09-06 12:10:00 | X9.3 | S09 | W34 | 2673 |
CME
| SEP Event Date | CME Time at 21.5Rsun | CME Lat | CME Lon | CME HA | CME 3D Velocity (km/s) | Source | CME LASCO C2 First Look Time | CME Plane of Sky Velocity (km/s) |
| September 4, 2017 | 2017-09-04 23:10:00 | -24 | 3 | 54 | 1323 | NOAA (Hazel) | 2017-09-04 20:36:05 | 1418 |
| September 6, 2017 | 2017-09-06 14:57:00 | -15 | 23 | 34 | 1816 | DONKI (Andrea Minot) | 2017/09/06 12:24:05 | 1571 |
GOES Proton Measurements for 2017-09-05


|
Above Left: From top to bottom, >10 MeV, >100 MeV, >30 MeV, >50 MeV, >60 MeV fluxes showing threshold (red dashed line), threshold crossings (black dotted lines), estimated onset peak (black circle), and maximum flux (red open circle). Plot will be missing if no threshold was crossed. Only the top plot was used to calculate values for this event. Above Right: All integral fluxes with start and end times for the different energy channels (dashed lines). Left: Fluence spectrum for integral fluxes calculated by applying the start and stop times derived for each channel. Only the >10 MeV fluences pertain to this event. |
Download observed values:
- GOES corrected integral fluxes (reported in tables below) - the json was modified by hand for this event so that the higher energy event on 9/6 was not included: json
- SEPEM RSDv2.0 background-subtracted (OpSEP method) and converted to integral fluxes: SEPEMv2 does not extend beyond 2015
- GOES uncorrected differential fluxes with Sandberg et al. 2014 and Bruno 2017 energy bins applied, background-subtracted, then converted to integral fluxes: json
Threshold: >10 MeV exceed 10 pfu
| SEP Event Date | Operational Satellite | >10 MeV, 10 pfu exceeded | >10 MeV Max Flux Time | >10 MeV Max Flux (pfu) | >10 MeV, 0.85*10 pfu End | >10 MeV Duration (hours) | >10 MeV Fluence (cm-2) | >100 MeV Fluence (cm-2) |
| September 4 and 6, 2017 | GOES-13 | 2017-09-05 0:40:00 | 2017-09-08 0:35:00 | 844.38 | 2017-09-08 15:40:00 | 87.17 | 4.15E+08 | 2.90E+05 |
Threshold: >100 MeV exceeds 1 pfu
| SEP Event Date | Operational Satellite | >100 MeV, 1 pfu exceeded | >100 MeV Max Flux Time | >100 MeV MaxFlux (pfu) | >100 MeV, 0.85*1 pfu End | >100 MeV Duration (Hours) | >10 MeV Fluence (cm-2) | >100 MeV Fluence (cm-2) |
| September 4 and 6, 2017 | GOES-13 | N/A | N/A | N/A | N/A | N/A | N/A | N/A |
GOES Proton Measurements for 2017-09-05
Above Left: From top to bottom, >10 MeV, >100 MeV, >30 MeV, >50 MeV, >60 MeV fluxes showing threshold (red dashed line), threshold crossings (black dotted lines), estimated onset peak (black circle), and maximum flux (red open circle). Plot will be missing if no threshold was crossed. Only the top plot was used to calculate values for this event. Above Right: All integral fluxes with start and end times for the different energy channels (dashed lines). Left: Fluence spectrum for integral fluxes calculated by applying the start and stop times derived for each channel. Only the >10 MeV fluences pertain to this event. |
Download observed values:
- GOES corrected integral fluxes (reported in tables below) - json file was modified by hand to account for the >10 MeV event starting on 9/4: json
- SEPEM RSDv2.0 background-subtracted (own method) and converted to integral fluxes: SEPEMv2 does not extend beyond 2015
- GOES uncorrected differential fluxes with Sandberg et al. 2014 and Bruno 2017 energy bins applied, background-subtracted, then converted to integral fluxes: json
Threshold: >10 MeV exceed 10 pfu
| SEP Event Date | Operational Satellite | >10 MeV, 10 pfu exceeded | >10 MeV Peak Time | >10 MeV Peak Flux (pfu) | >10 MeV, 0.85*10 pfu End | >10 MeV Duration (hours) | >10 MeV Fluence (cm-2) | >100 MeV Fluence (cm-2) |
| September 4, 2017 | GOES-13 | 2017-09-05 0:40:00 | 2017-09-08 0:35:00 | 844.38 | 2017-09-08 15:40:00 | 87.17 | 4.15E+08 | 2.90E+05 |
Threshold: >100 MeV exceeds 1 pfu
| SEP Event Date | Operational Satellite | >100 MeV, 1 pfu exceeded | >100 MeV Peak Time | >100 MeV Peak Flux (pfu) | >100 MeV, 0.85*1 pfu End | >100 MeV Duration (Hours) | >10 MeV Fluence (cm-2) | >100 MeV Fluence (cm-2) |
| September 4, 2017 | GOES-13 | N/A | N/A | N/A | N/A | N/A | N/A | N/A |
GOES Proton Measurements for 2017-09-06


Above Left: From top to bottom, >10 MeV, >100 MeV, >30 MeV, >50 MeV, >60 MeV fluxes showing threshold (red dashed line), threshold crossings (black dotted lines), estimated onset peak (black circle), and maximum flux (red open circle). Plot will be missing if no threshold was crossed. The top plot was excluded when calculating values for this event. Above Right: All integral fluxes with start and end times for the different energy channels (dashed lines). Left: Fluence spectrum for integral fluxes calculated by applying the start and stop times derived for each channel. Only the >30, >50, and >60 MeV fluences pertain to this event. |
Only >30, >50, and >60 MeV fluxes has separate values for validating this event. The >10 MeV fluxes elevated on September 5 and continued to be elevated until September 9. Higher energy fluxes (>30, >50, and >60 MeV) elevated on September 6 as a separate event. The >100 MeV fluxes were not elevated for either event. The values for >30, >50, and >60 MeV can be found in the json files.
Download observed values:
- GOES corrected integral fluxes (reported in tables below): csv, json
- SEPEM RSDv2.0 background-subtracted (own method) and converted to integral fluxes: SEPEMv2 does not extend beyond 2015
- GOES uncorrected differential fluxes with Sandberg et al. 2014 and Bruno 2017 energy bins applied, then converted to integral fluxes: csv, json
Threshold: >10 MeV exceed 10 pfu - continues from September 4
| SEP Event Date | Operational Satellite | >10 MeV, 10 pfu exceeded | >10 MeV Peak Time | >10 MeV Peak Flux (pfu) | >10 MeV, 0.85*10 pfu End | >10 MeV Duration (hours) | >10 MeV Fluence (cm-2) | >100 MeV Fluence (cm-2) |
| September 6, 2017 | GOES-13 | N/A | N/A | N/A | N/A | N/A | N/A | N/A |
Threshold: >100 MeV exceeds 1 pfu
| SEP Event Date | Operational Satellite | >100 MeV, 1 pfu exceeded | >100 MeV Peak Time | >100 MeV Peak Flux (pfu) | >100 MeV, 0.85*1 pfu End | >100 MeV Duration (Hours) | >10 MeV Fluence (cm-2) | >100 MeV Fluence (cm-2) |
| September 6, 2017 | GOES-13 | N/A | N/A | N/A | N/A | N/A | N/A | N/A |
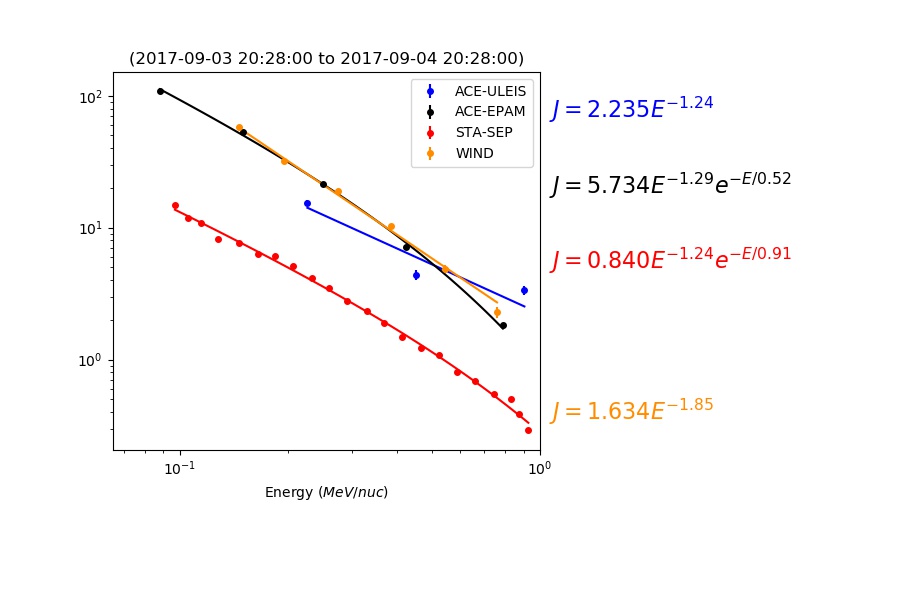
Seed Population and Solar Wind
Earth


STEREO-A
