January 6, 2014


Database links:
https://cdaw.gsfc.nasa.gov/CME_list/UNIVERSAL/2014_01/univ2014_01.html
https://kauai.ccmc.gsfc.nasa.gov/DONKI/view/SEP/4332/1
http://sidc.oma.be/cactus/catalog/LASCO/2_5_0/qkl/2014/01/latestCMEs.html
Flare
| SEP Event Date | Flare Onset Time | Flare Peak Time | Flare End Time | Flare Magnitude | Flare Lat | Flare Lon | Active Region |
| January 6, 2014 | over west limb | - | - | - | - | - | - |
CME
| SEP Event Date | CME Time at 21.5Rsun | CME Lat | CME Lon | CME HA | CME 3D Velocity (km/s) | Source | CME LASCO C2 First Look Time | CME Plane of Sky Velocity (km/s) |
| January 6, 2014 | 2014-01-06 10:38:00 | 8 | 110 | 85 | 1200 | DONKI (Leila) | 2014-01-06 8:00:05 | 1402 |
GOES Proton Measurements


|
Above Left: From top to bottom, >10 MeV, >100 MeV, >30 MeV, >50 MeV, >60 MeV fluxes showing threshold (red dashed line), threshold crossings (black dotted lines), estimated onset peak (black circle), and maximum flux (red open circle). Plot will be missing if no threshold was crossed. Above Right: All integral fluxes with start and end times for the different energy channels (dashed lines). Left: Fluence spectrum for integral fluxes calculated by applying the start and stop times derived for each channel. |
Download observed values:
- GOES corrected integral fluxes (reported in tables below): json
- SEPEM RSDv2.0 background-subtracted (OpSEP method) and converted to integral fluxes: json
- GOES uncorrected differential fluxes with Sandberg et al. 2014 and Bruno 2017 energy bins applied, background-subtracted, then converted to integral fluxes: json
Threshold: >10 MeV exceed 10 pfu
| SEP Event Date | Satellite | >10 MeV, 10 pfu exceeded | >10 MeV Max Flux Time | >10 MeV Max Flux (pfu) | >10 MeV, 0.85*10 pfu End | >10 MeV Duration (hours) | >10 MeV Fluence (cm-2) | >100 MeV Fluence (cm-2) |
| January 6, 2014 | GOES-13 | 2014-01-06 9:15:00 | 2014-01-06 16:00:00 | 42.17 | 2014-01-07 19:30:00 | 34.25 | 3.91E+07 | 1.33E+06 |
Threshold: >100 MeV exceeds 1 pfu
| SEP Event Date | Satellite | >100 MeV, 1 pfu exceeded | >100 MeV Max Flux Time | >100 MeV MaxFlux (pfu) | >100 MeV, 0.85*1 pfu End | >100 MeV Duration (Hours) | >10 MeV Fluence (cm-2) | >100 MeV Fluence (cm-2) |
| January 6, 2014 | GOES-13 | 2014-01-06 8:30:00 | 2014-01-06 10:05:00 | 4.079 | 2014-01-06 18:50:00 | 10.33 | 1.50E+07 | 1.03E+06 |
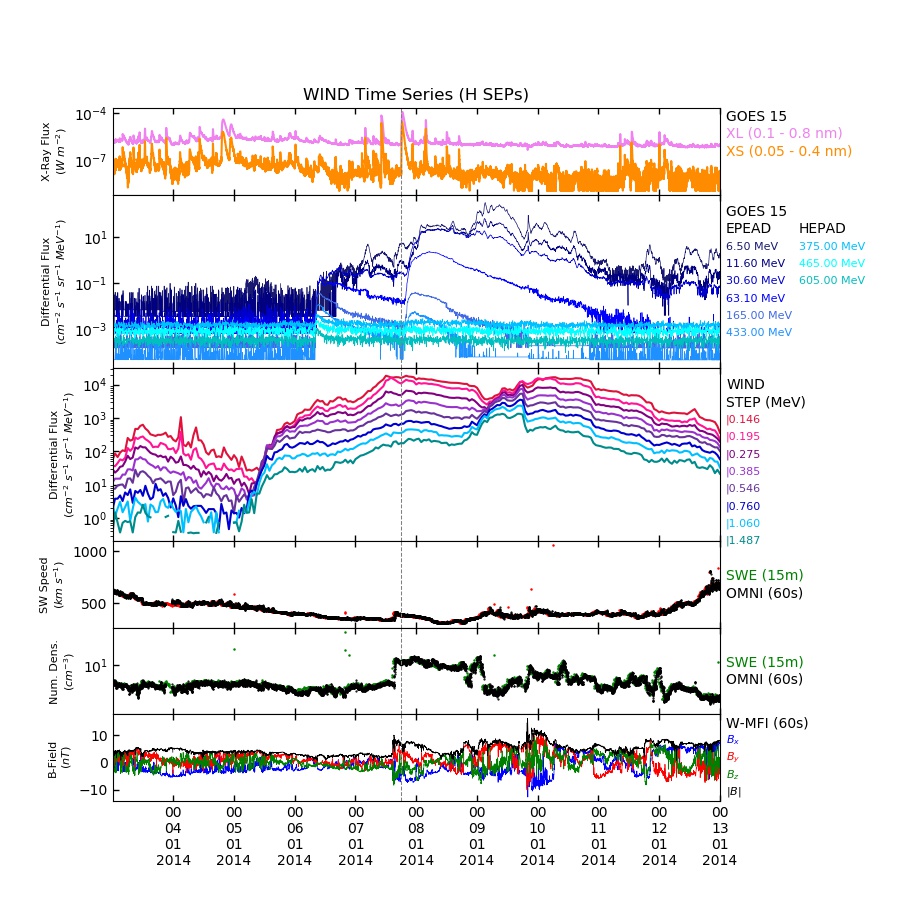
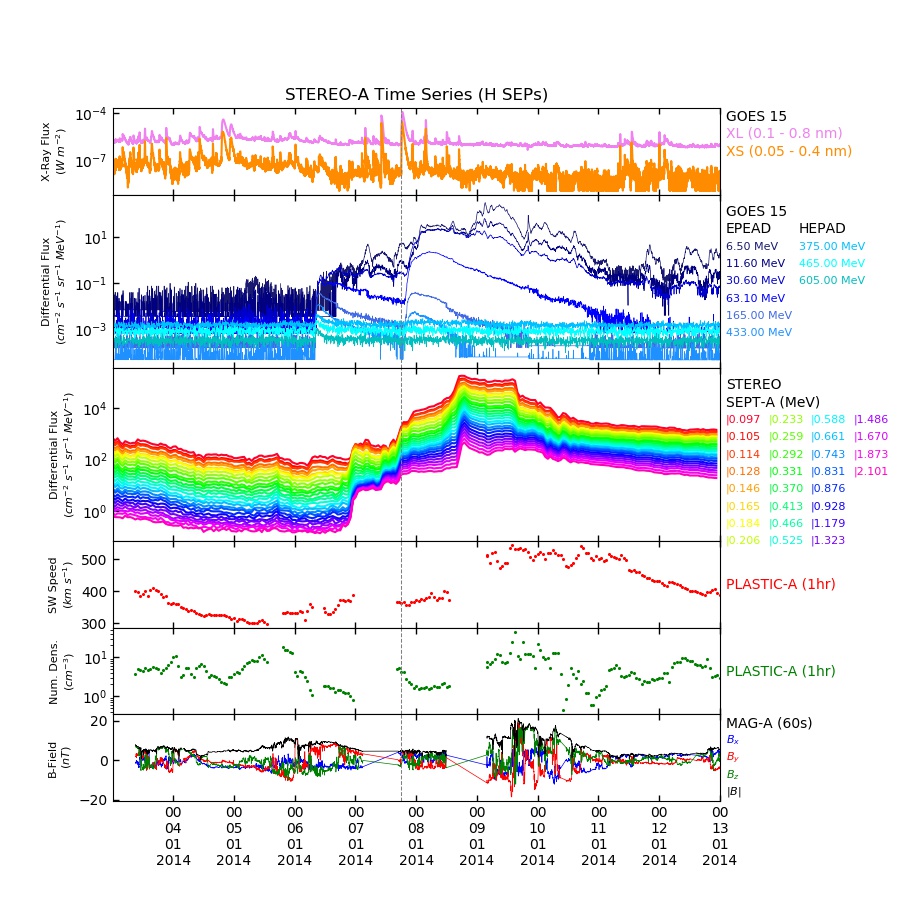
Seed Population and Solar Wind
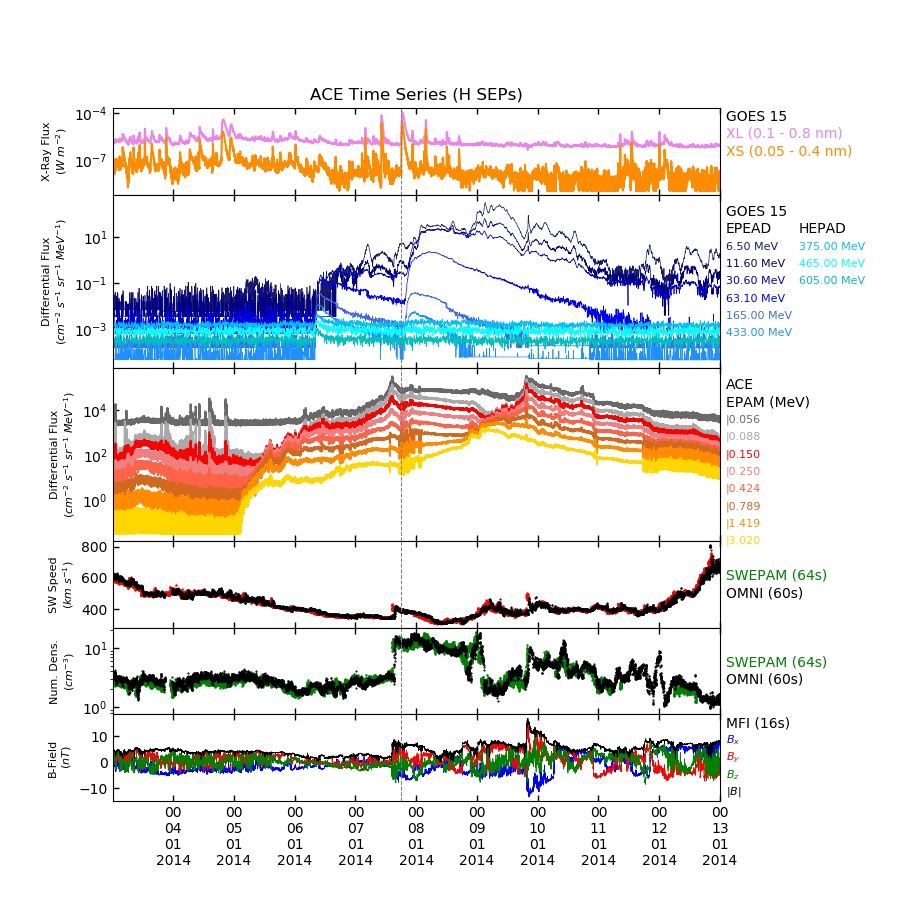
Earth
STEREO-A
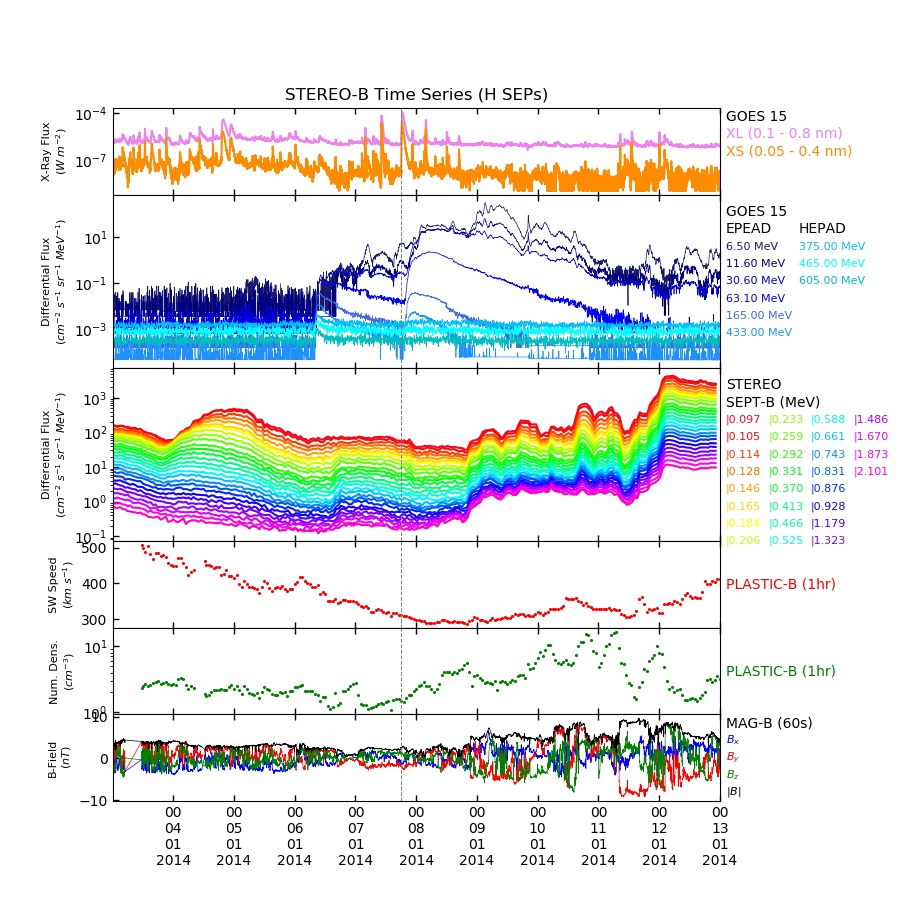
STEREO-B