Validation
Validation Framework
Here we describe the progress that has been made towards accomplishing validation of SEP models, including the validation approach and products. The most recent progress was summarized here for ISWAT 2021.
The validation code is being written in python for this effort and is designed to compliment the SEP Scoreboard developed at CCMC. The validation code uses the same input json file format as the SEP Scoreboard, described here. This is done with the idea that, in the long-term, model forecasts submitted to the SEP Scoreboard may also be automatically validated against data without any additional work from modelers. SRAG is actively working with the M2M office to develop an automated scheme to validate forecasts coming into the SEP Scoreboard in real-time.
Modelers are encouraged to submit their predictions to this challenge using the CCMC json format, however any formats are accepted. For models that produce flux time profiles, you (or Katie) can use operational_sep_quantities.py to automatically create the json files for validation.
Observational values used in validation are produced with the OpSEP code developed for this effort (described in further detail on the Data Sets page). The values are saved into a json file that mirrors the CCMC json format. This allows for easy comparison of like quantities.
To date (2021-10-21), the validation code has been written to:
- Accept a list of any number of observations and any number of model predictions by any number of models
- Automatically matches observations with model output for each SEP event
- Validates the following quantities, as appropriate for each model:
- All Clear (threshold crossed/not crossed)
- Probability
- Start Time
- End Time
- Threshold Crossing Time
- Onset Peak Flux
- Maximum Flux
- Event Fluence
- Flux Time Profile
- Derives the following metrics, as appropriate to each quantity:
- Contingency Table
- Skill Scores: Hits, Misses, False Alarms, Correct Negatives, Percent Correct, Bias, Hit Rate, False Alarm Ratio, False Alarm Rate, Frequency of Hits, Frequency of Misses, Probability of Correct Negatives, Detection Failure Ratio, Frequency of Correct Negatives, Threat Score, Odds Ratio, G Skill Score, True Skill Score, Heidke Skill Score, Odds Ratio Skill Score
- Metrics: Mean Log Error, Median Log Error, Mean Absolute Error, Median Absolute Error, Pearson's Correlation Coefficient (linear and log comparisons)
- Correlation Plots with linear regression lines
- Box Plots showing distribution of SEP model results across all events
- Time profile plots showing data and model plotted together
- Generates pdf reports of each model's performance
- Generates a combined model report (if multiple models validated simultaneously), comparing the performance of each model
View an example report for UMASEP-10. Note that the results in this report are not representative of a true validation due to the small number of events.
So far, the model validation work has focused on the operational thresholds >10 MeV, 10 pfu and >100 MeV, 1 pfu. Not all models produce forecasts for these thresholds, so we have also included >30 MeV, 1 pfu, >50 MeV, 1 pfu, and >60 MeV, 0.079 pfu.
It is possible to validate against any SEP data set, so models may produce forecasts in energy channels (both integral and differential) corresponding to any instrumentation available and it is possible to validate through this code.
Quantities, thresholds, and metrics can always be added according to feedback from the community.
Additional description of the validation work along with a description of SEP model needs with respect to human exploration operations can be found in links on the Conferences page.
Observational Data Sets
Choice of Data Sources
The majority of the work done so for the SEP Model Validation effort has focused on GOES integral fluxes, which are the data streams monitored at the NOAA Space Weather Prediction Center (SWPC) for forecasting and NASA Space Radiation Analysis Group (SRAG) for human space operations.
We recognize that the GOES data sets have certain drawbacks. Indeed, the various experiments and proton data sets available all have strengths and weaknesses. We are putting effort into understanding the data sets and determining the best use of each for validation - both from an operational and scientific perspective.
A document titled Proton and Ion Data Sets that are Typically Used to Measure SEPs: Description and Caveats has been drafted describing the strengths and drawbacks of each proton experiment with recommendations about their best use in validation. We invite the community to review this document and provide feedback/comments.
Access the google doc here.
Calculation of SEP Event Quantities for this Effort
The quantities shown throughout the site and in the downloadable files were calculated event-by-event using the OpSEP code written by Kathryn Whitman for this effort. The code is publicly available at: https://github.com/ktindiana/operational-sep
- This code has a few "native" data sets, including GOES-08 to GOES-15, SOHO/EPHIN, and SEPEM RSDv2.0. The user may apply different recalibrated effective energies to GOES differential channels as reported in the literature by Sandberg et al. 2014 and Bruno 2017.
- Users may also input their own data sets of fluxes with time. In this way, model time profiles can be assessed in exactly the same way as observed time profiles.
- Differential fluxes are converted to integral fluxes within the code. Gaps in time (bad flux values below 0) are interpolated in time to get a better estimate of event fluence.
- Users may specify dates that represent background levels and perform background subtraction.
- The code always applies >10 MeV, 10 pfu and >100 MeV, 1 pfu thresholds to define SEP events. Users may specify their own thresholds which may be applied to integral or differential channels.
- All values in the code are calculated in an automated way to ensure reproducibility from one user to the next.
The code calculates the following values and outputs them in both csv format and json files that mirror the json files used by CCMC's SEP Scoreboard for model forecasts:
- >10 MeV, 10 pfu and >100 MeV, 1 pfu threshold crossings
- Onset peak flux and time (identified by an automated algorithm that works fairly well, but perhaps may be improved)
- Maximum peak flux and time
- Duration
- Event fluence spectrum
Examples of output produced by operational_sep_quantities.py
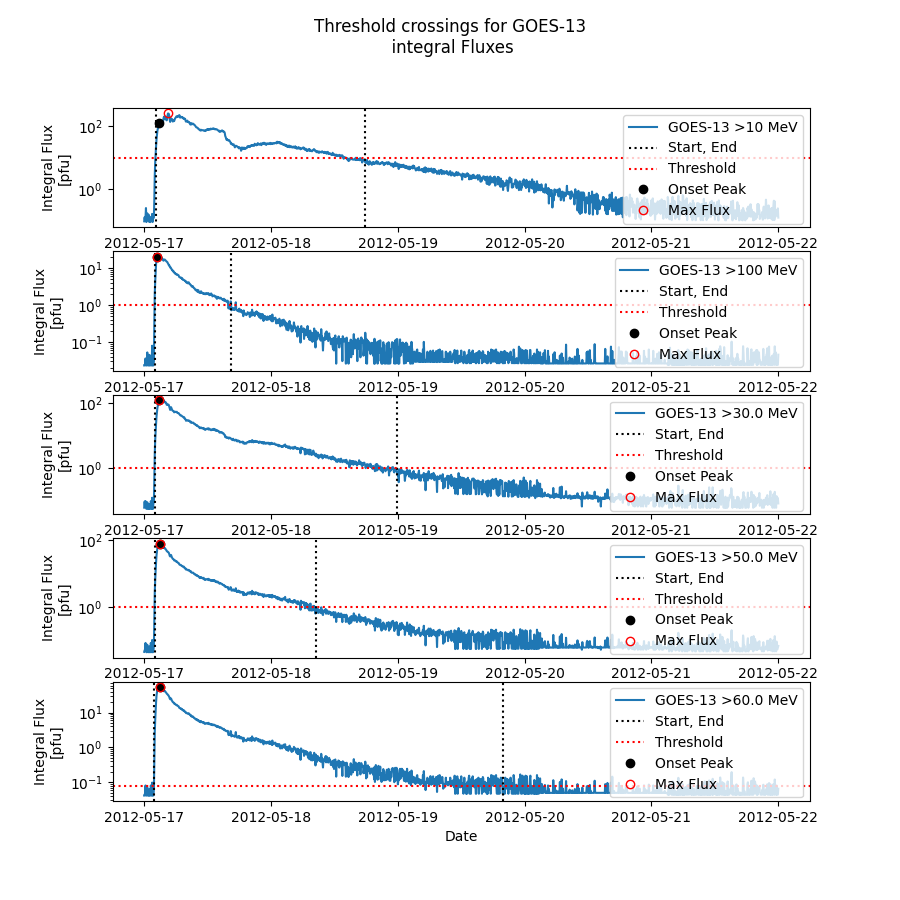
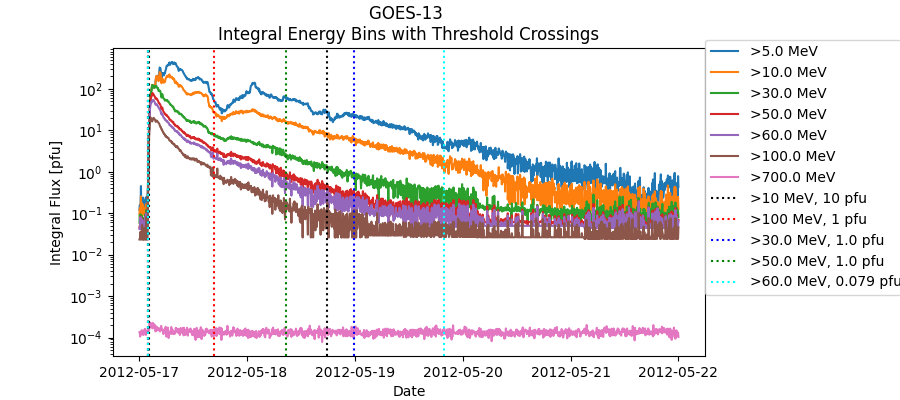
2012-05-17 GOES-13 Integral Fluxes
GOES integral fluxes are tested again operational and other thresholds. In this case:
- >10 MeV, 10 pfu
- >100 MeV, 1pfu
- >30 MeV, 1 pfu
- >50 MeV, 1 pfu
- >60 MeV, 0.079 pfu
Start and end times, the onset peak and time, and the maximum flux value and time are identified. The values shared throughout this website correspond to the case described here.
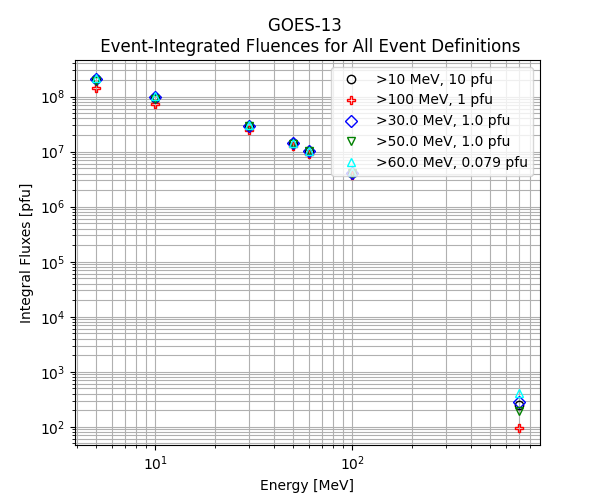
Because the original input data set consisted of integral fluxes, the integral fluence spectrum is calculated for each threshold definition. In other words, each data point in the plot below shows the fluence for the GOES integral channels (>5, >10, >30, >50, >60, >100, >700 MeV).
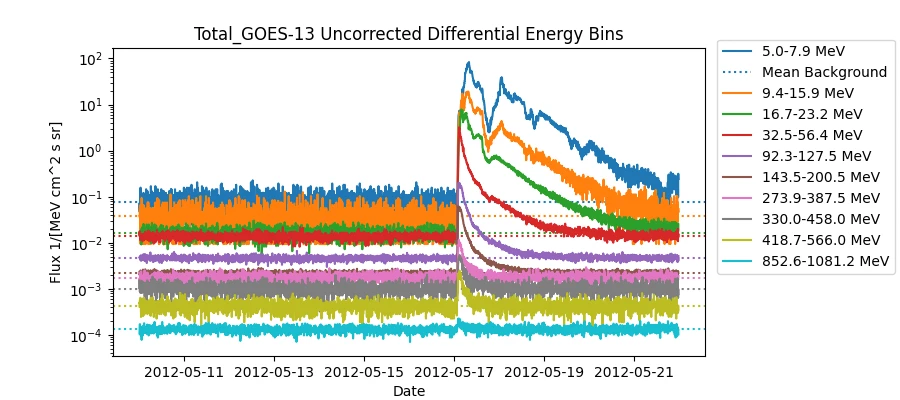
2012-05-17 GOES-13 Uncorrected Differential Fluxes with Sandberg et al. and Bruno 2017 Effective Energies Applied
Users may opt to choose GOES fluxes and apply energy calibrations that have been reported in the literature. The plot below shows the total flux for a time period containing an appropriate background prior to the SEP event and the SEP event flux for GOES-13 uncorrected differential fluxes. The energies in the legend correspond to the Sandberg et al. 2014 effective energies for EPEAD and the Bruno 2017 effective energies for EPEAD channels above 80 MeV and HEPAD.
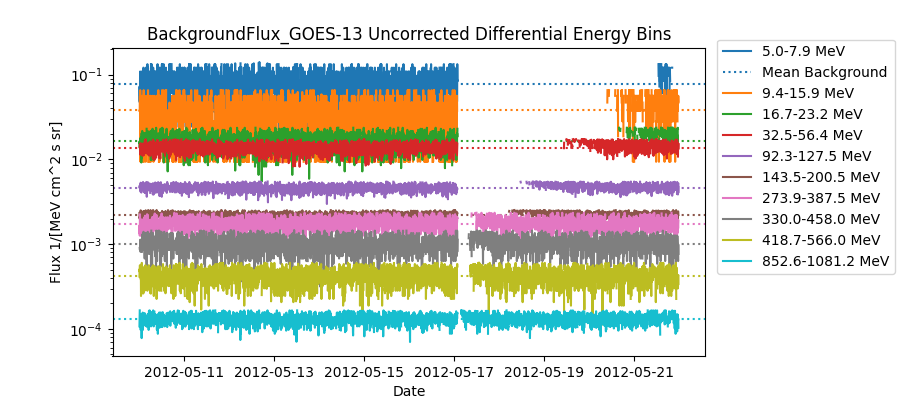
A background period is identified by the user (2012-05-10 to 2012-05-16) and a mean background level and expected amount of variation (sigma) is calculated. All fluxes below mean + n*sigma (in this case n = 2.0) are identified as background, shown in the plot below. The mean background levels are identified as dashed lines.
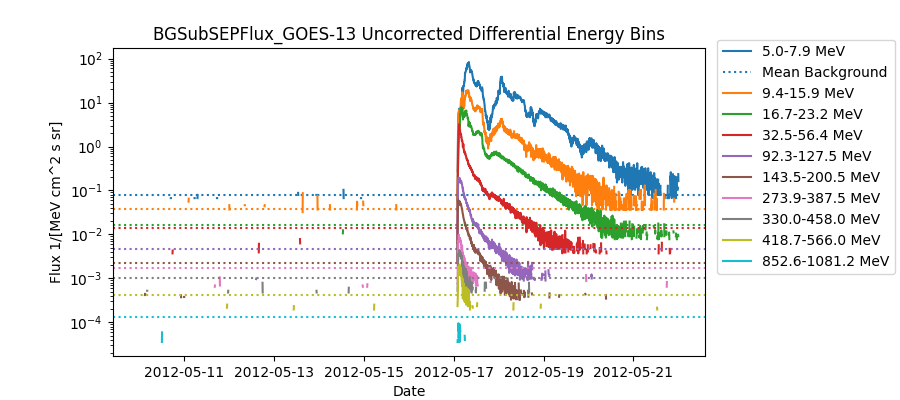
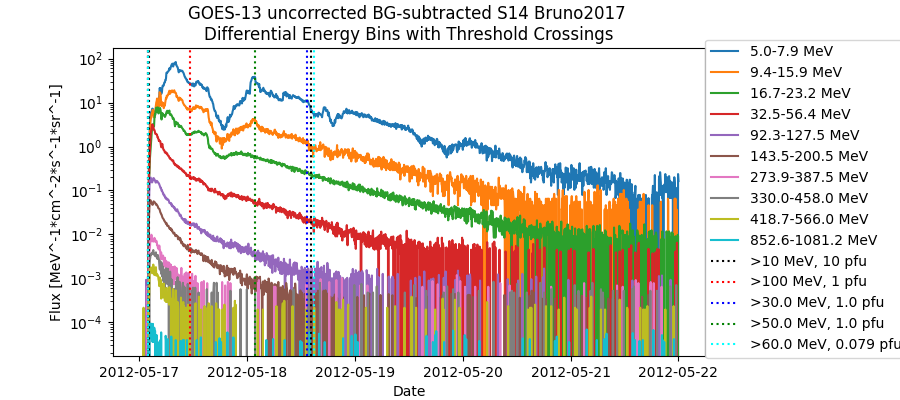
All values above the mean + n*sigma (in this case n = 2.0) are identified as elevated SEP fluxes and the mean background is subtracted from each channel. The plot below shows the SEP background-subtracted fluxes with the mean background levels shown as dashed lines.
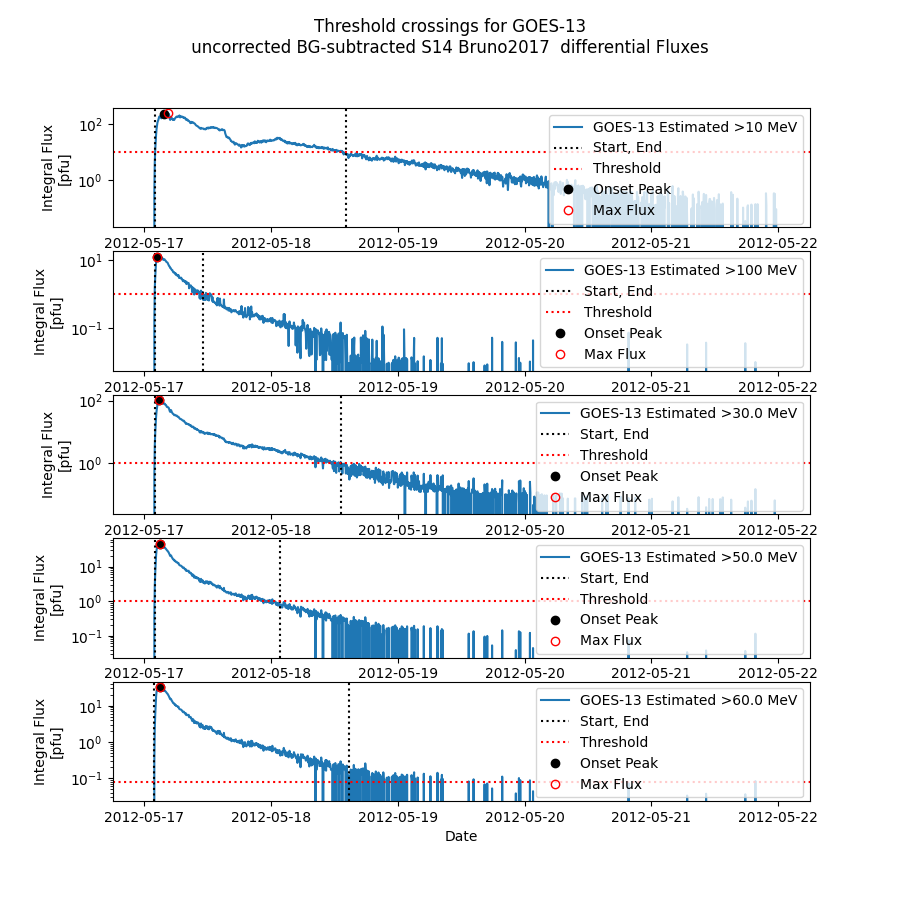
The background-subtracted differential fluxes are converted to integral fluxes and checked against the operational and other thresholds. Start and end times, the onset peak and the maximum flux are identified (below left). The background-subtracted differential fluxes are plotted with the start and stop times for each threshold definition (below right).
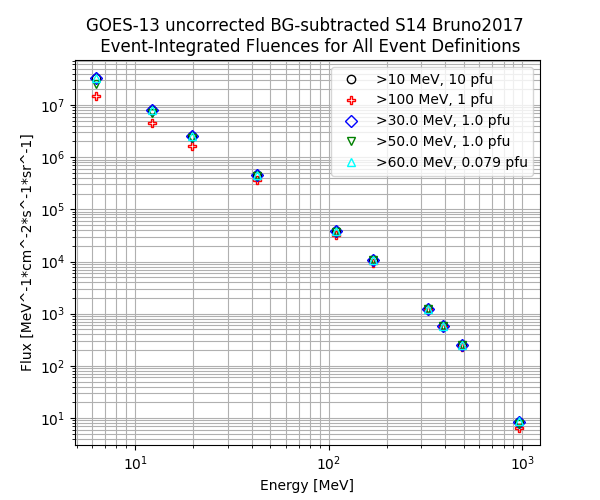
Because the original input data set was differential fluxes, the background-subtracted differential fluence spectrum is calculated between the start and end times for each threshold (below).
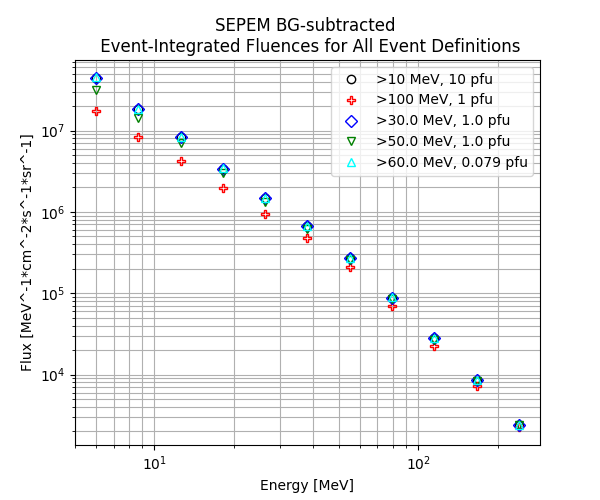
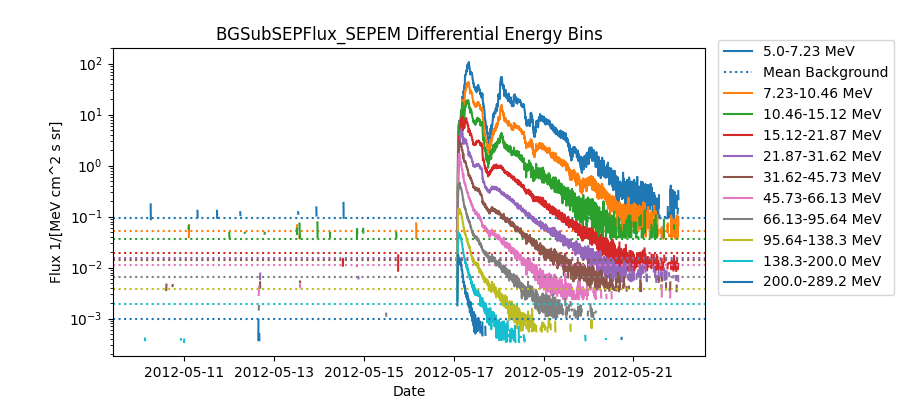
2012-05-17 SEPEM RDSv2.0 Background-Subtracted Differential Fluxes
The SEPEM RDSv2.0 data set is a data set derived from GOES experiments that have been cross-calibrated to IMP-8 fluxes. It is a long baseline data set that extends from 1974 - 2015 and is provided through the sepem.eu website. If the user downloads this data set, operational_sep_quantities.py can use it to calculate validation quantities. The plot below shows the total flux in the SEPEM data set for a time period containing an appropriate background prior to the SEP event and the SEP event flux.
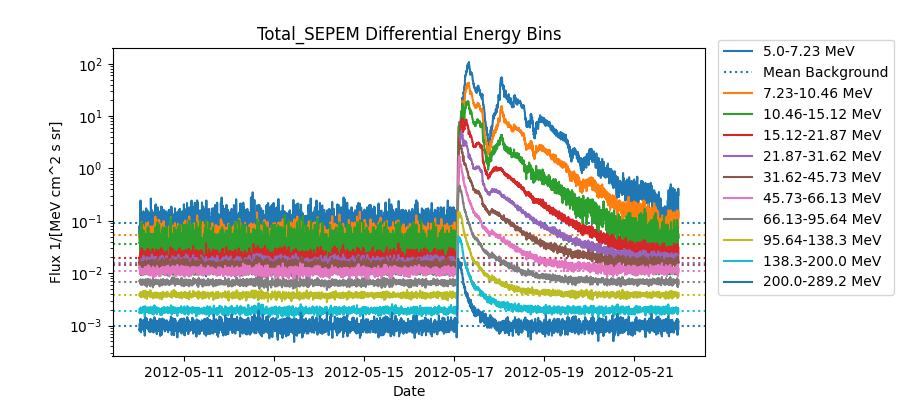
A background period is identified by the user (2012-05-10 to 2012-05-16) and a mean background level and expected amount of variation (sigma) is calculated. All fluxes below mean + n*sigma (in this case n = 2.0) are identified as background, shown in the plot below. The mean background levels are identified as dashed lines.
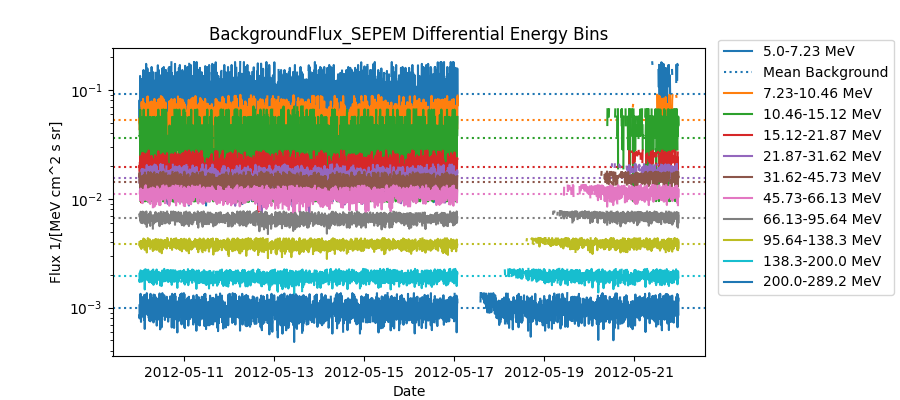
All values above the mean + n*sigma (in this case n = 2.0) are identified as elevated SEP fluxes and the mean background is subtracted from each channel. The plot below shows the SEP background-subtracted fluxes with the mean background levels shown as dashed lines.
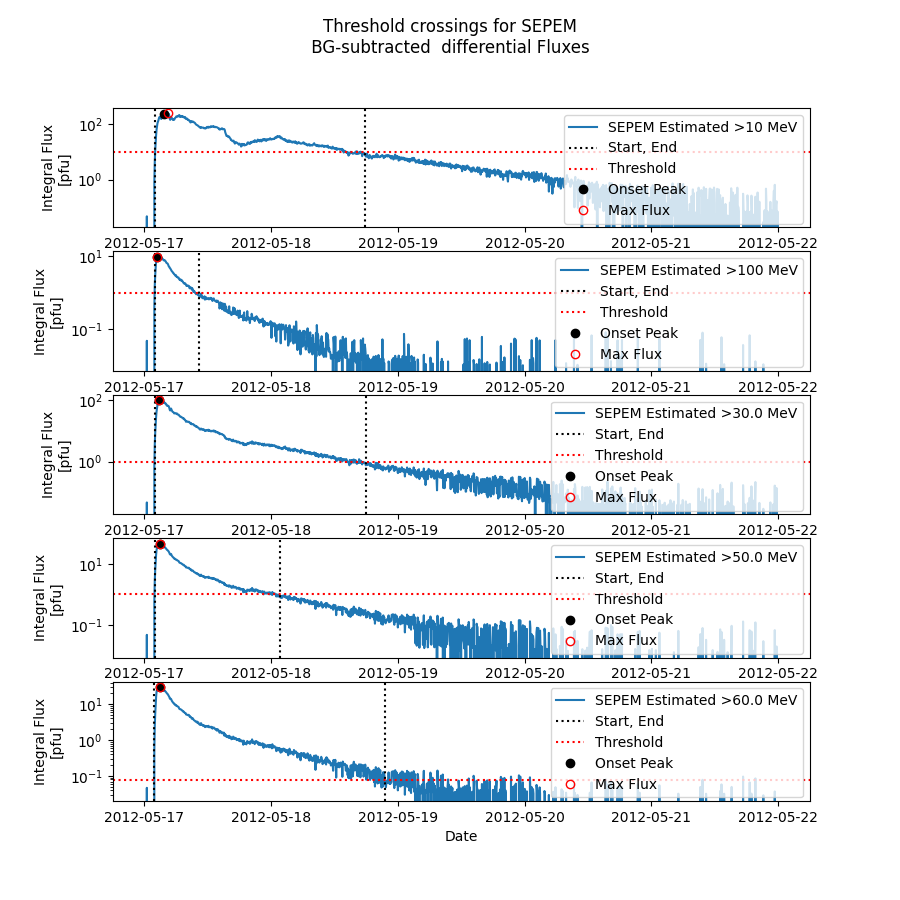
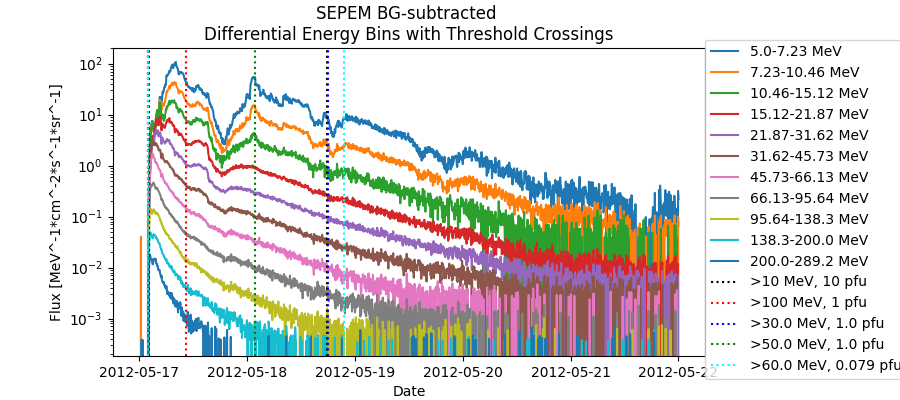
The background-subtracted differential fluxes are converted to integral fluxes and checked against the operational and other thresholds. Note that the SEPEM data set only goes up to 289 MeV, so the >100 MeV fluxes are likely underestimated. Start and end times, the onset peak and the maximum flux are identified (below left). The background-subtracted differential fluxes are plotted with the start and stop times for each threshold definition (below right).
Because the original input data set was differential fluxes, the background-subtracted differential fluence spectrum is calculated between the start and end times for each threshold (below).