PSI web report#
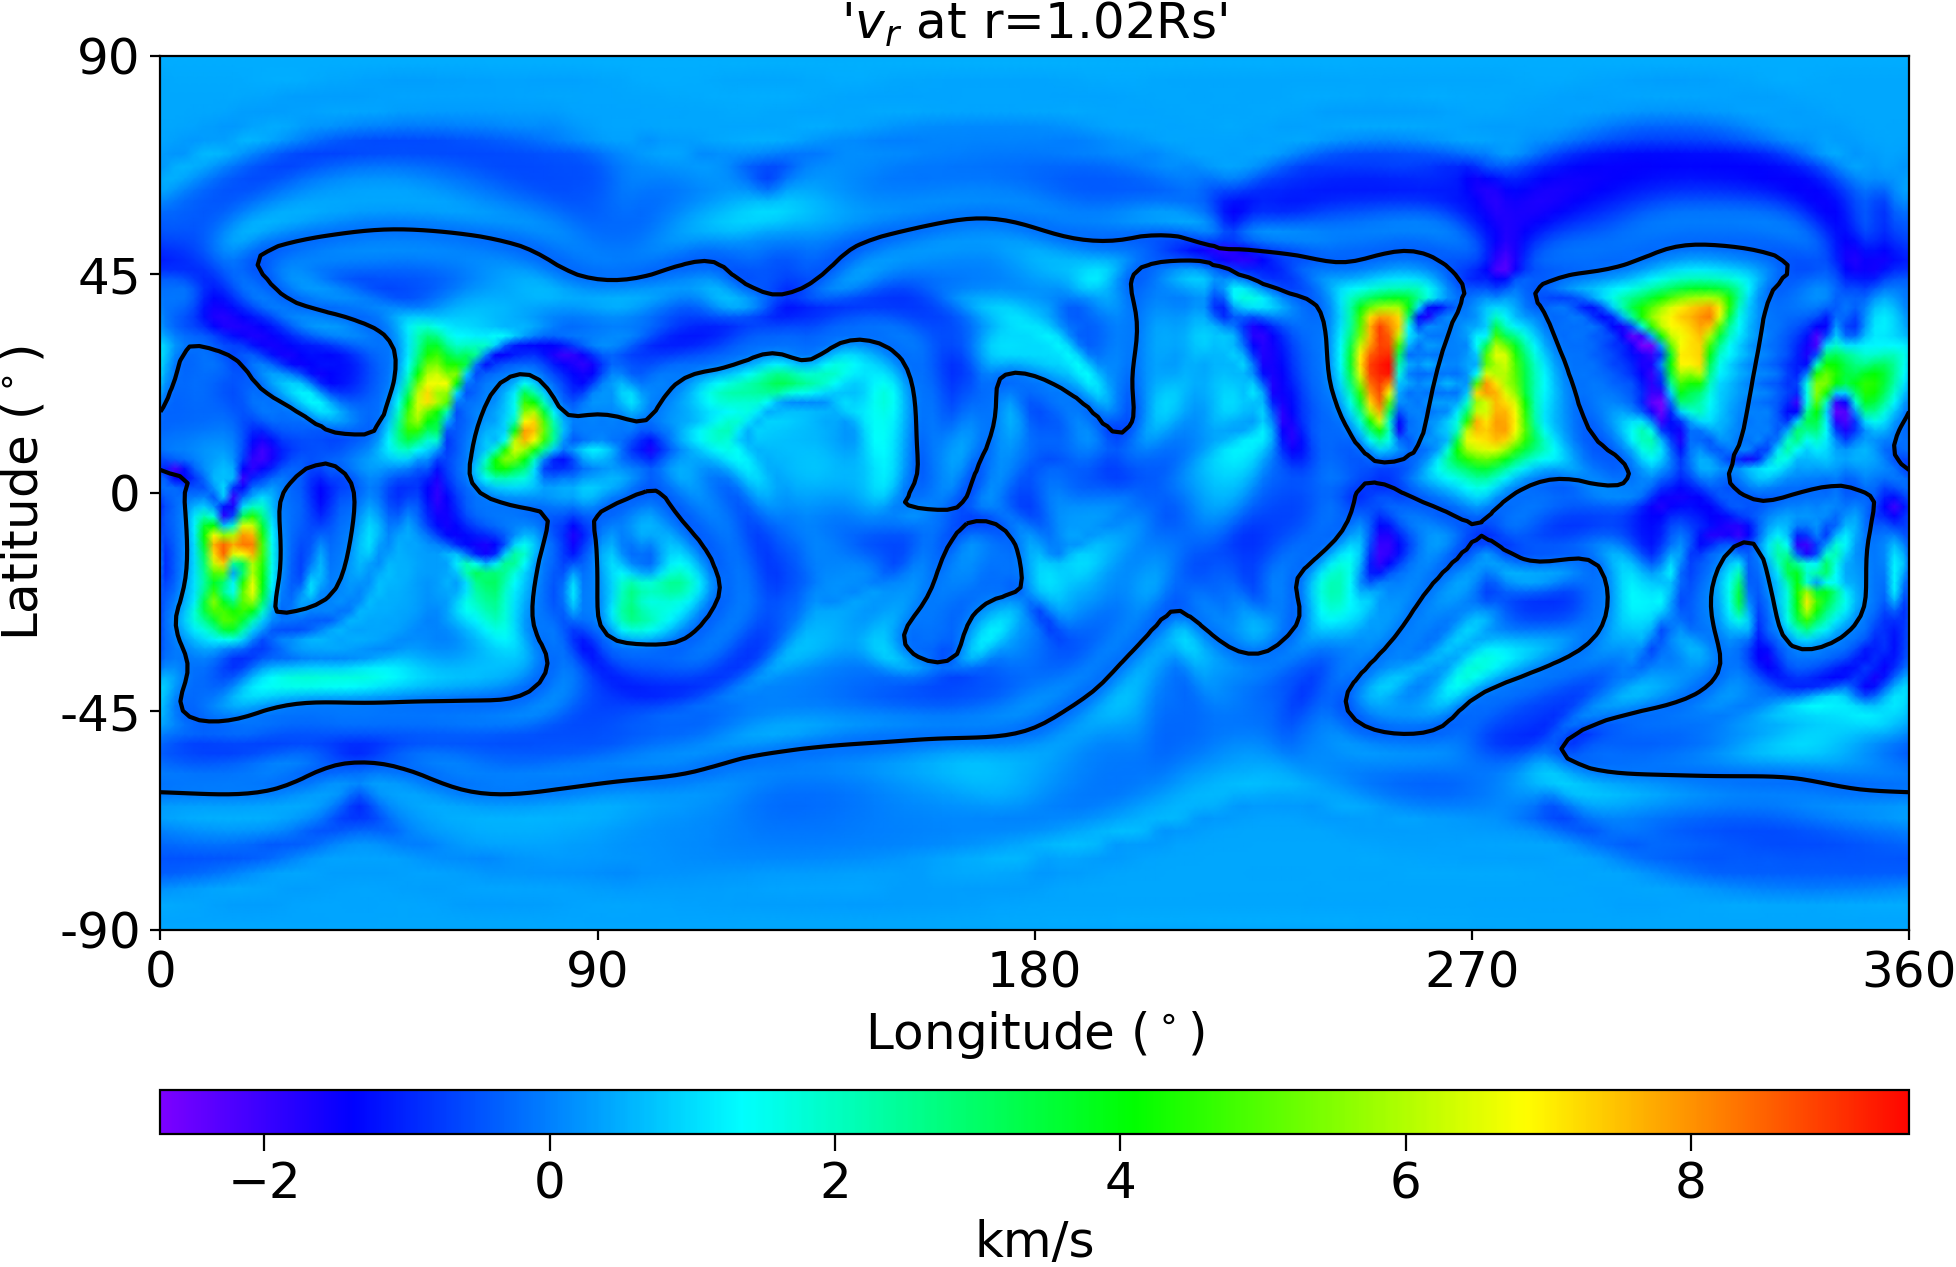
The following figures show 2d summary plots. Use the drop down menu and sliders to select variable and 2d slice. The black contour in each plot shows the locations where Br=0.
The following figures show 2d summary plots. Use the drop down menu and sliders to select variable and 2d slice. The black contour in each plot shows the locations where Br=0.