Sample plot of SWFT modeling and multilinear analysis

SWFT sample plot explaining time periods relative to selected da
y
(The example shows the different time periods. The resulting forecast model can be inproved.)

SWFT model instant run submission

Current Epoch (the start of the learning interval through the end of the forecast period must be between 2000/08/01 01:00 UT and 2012/12/31 23:59 UT):
  • Year:

  • Month:

  • Day:

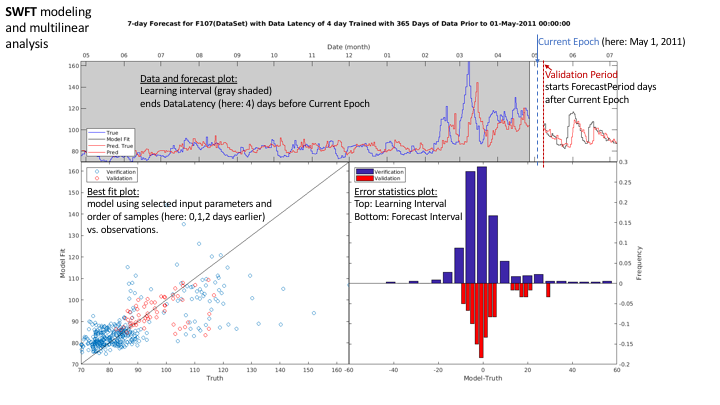
    Data latency [days] (day of latest available data before current day during forecast):

    Learning Interval [days]:

    Forecast Lead Time (default: 1 day; minimum: 0 days, 3 hours):

      Days:

      Hours:

    Cross validation Duration of forecast (validation) [days]:

Forecast type:
  • Data Forecast
  • Categorical Forecast
Parameter to forecast:
  • Select forecast type to get variable list
Parameter statistics (Average/Single value, Minimum, Maximum, Median, or Variance, as applicable):
  • Select forecast variable to get list of statistics