Input parameters.
back to topMAS parameters indicate the MHD run used as input of the EPREM simulation model. The others are EPREM input parameters used to generate this simulation results.
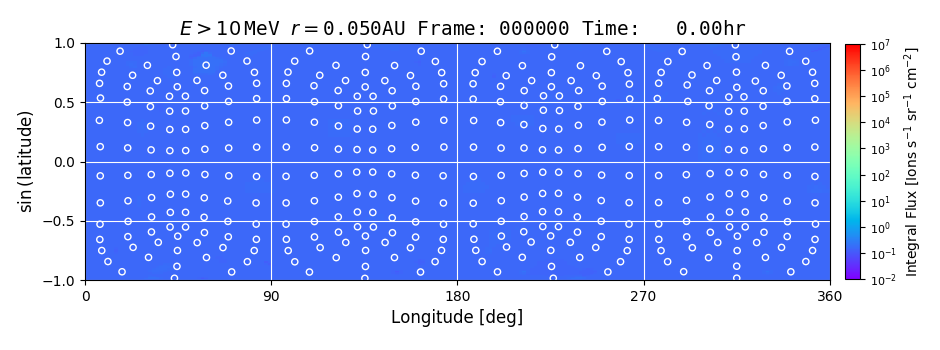
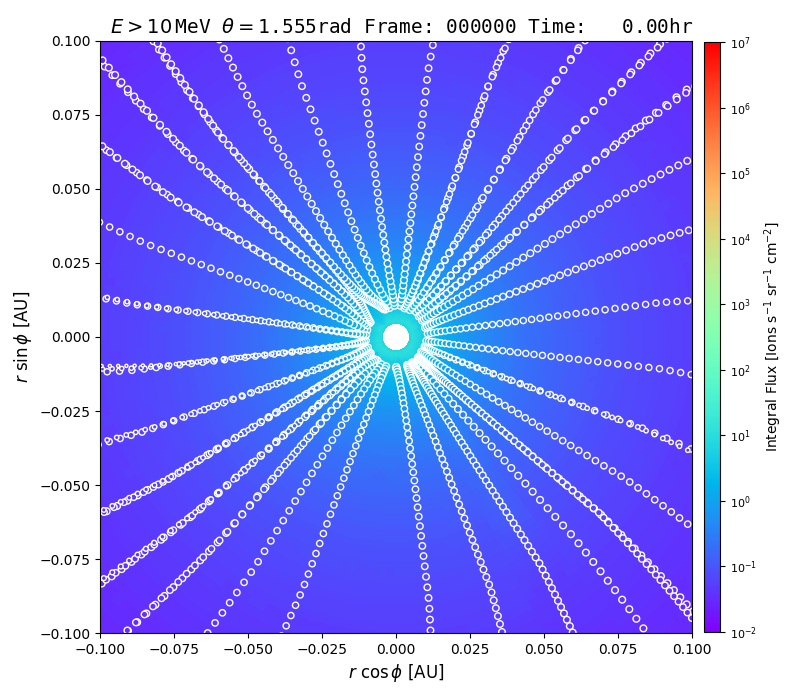
Map of model particle flux in selected GOES energy bins at a radial slice.
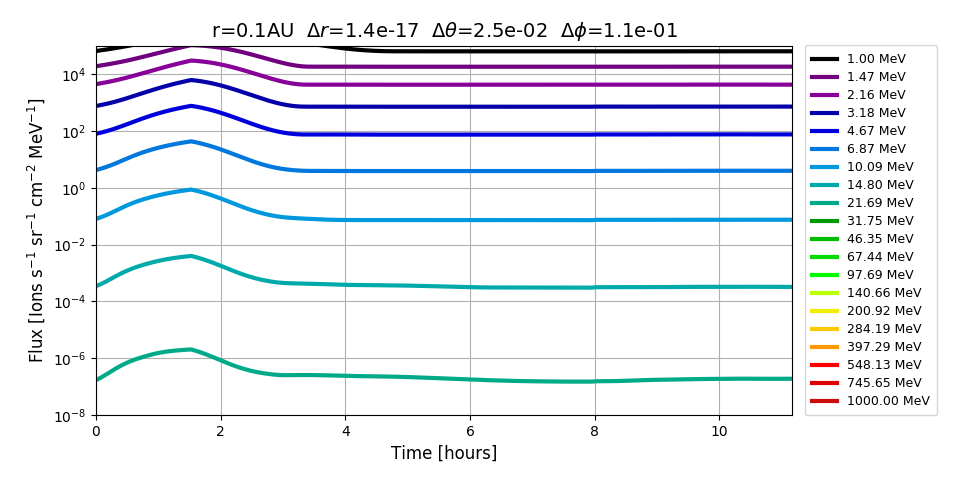
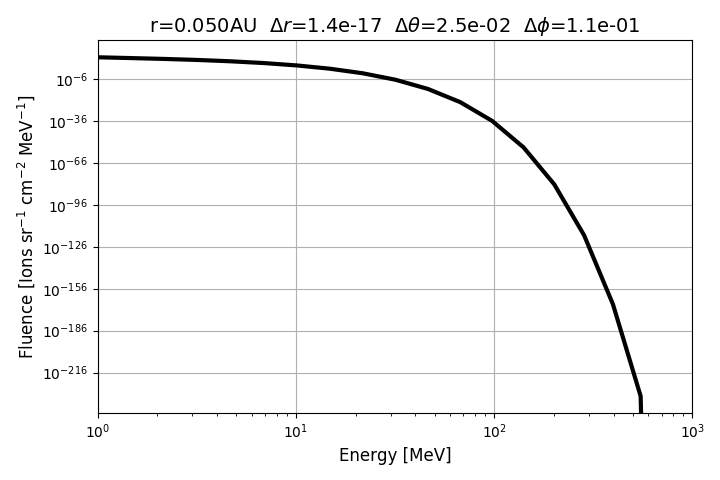
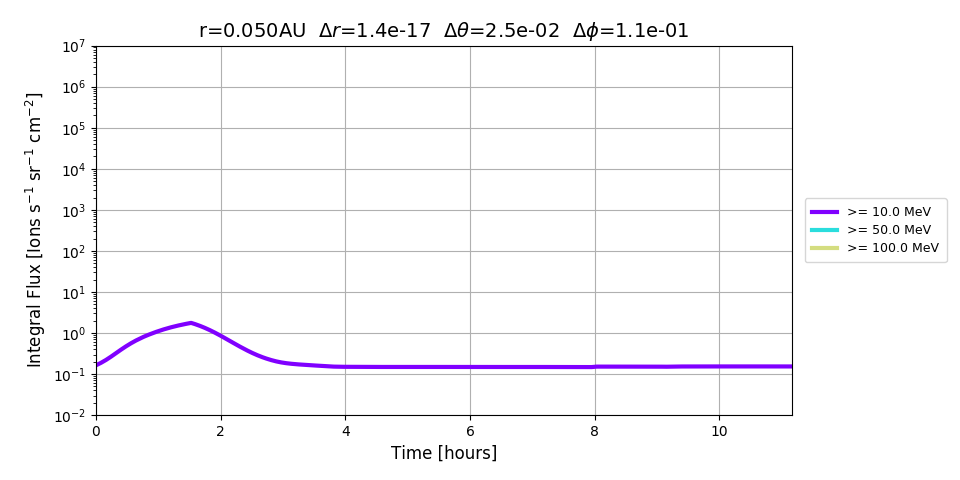
back to topInterpolated particle flux in NOAA GOES energy bins (> 10, > 50, or > 100 MeV) predicted by the model, plotted on a longitude vs sin(latitude) map, either at 0.05 AU (Domain: Corona) or 1 AU (Domain: Heliosphere). Use the Energy menu to select the GOES energy bin displayed. Circles indicate the location of EPREM nodes. A diamond on the heliospheric plot indicates the Earth. Clicking on the contour map will select the closest node, highlight the node in yellow, and update the 1D plots. The 1D plots display the particle fluxes as a function of energy (leftmost frame), the particle fluences (center frame), and the particle fluxes in the NOAA GOES energy bins (rightmost frame) at the selected node. Note that the heliospheric domain availability depends on the outer radial boundary of the EPREM simulation run.
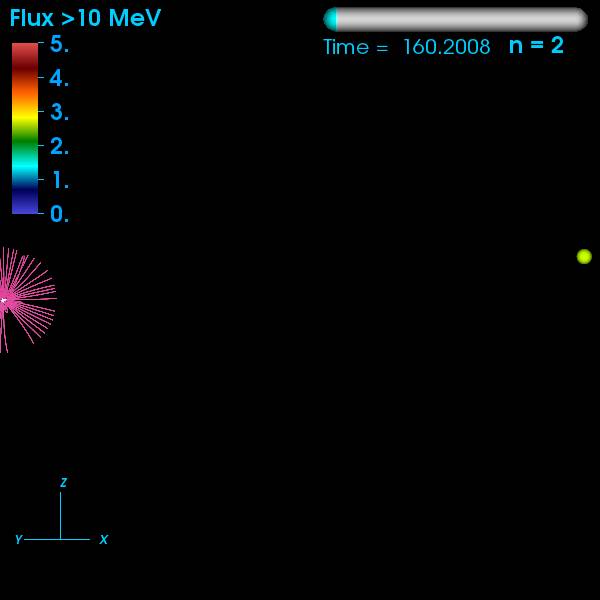
Model particle flux in selected GOES energy bins in the heliographic plane.
back to topInterpolated particle flux in NOAA GOES energy bins (> 10, > 50, or > 100 MeV) predicted by the model, plotted in the heliographic plane. Circles indicate the location of EPREM nodes projected onto the heliographic plane. A diamond on the heliospheric plot indicates the Earth. Under Domain, select Corona to visualize near the Sun (up to 0.1 AU) or select Heliosphere to visualize to 1 AU. Use the Energy menu to select the GOES energy bin displayed. Note that the heliospheric domain availability depends on the outer radial boundary of the EPREM simulation run.
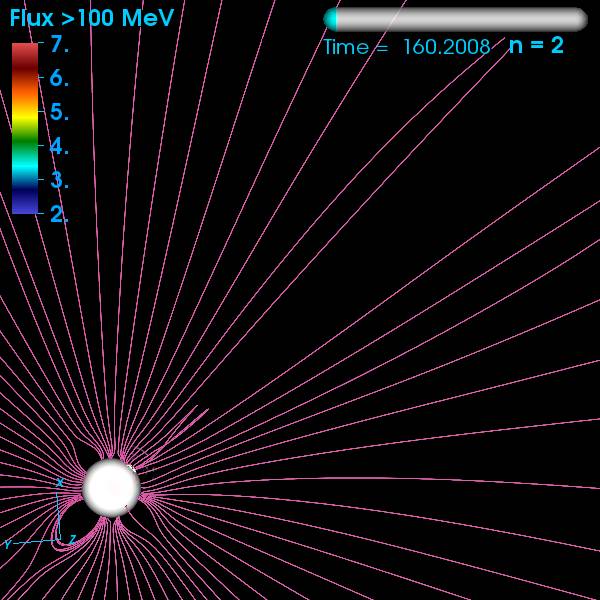
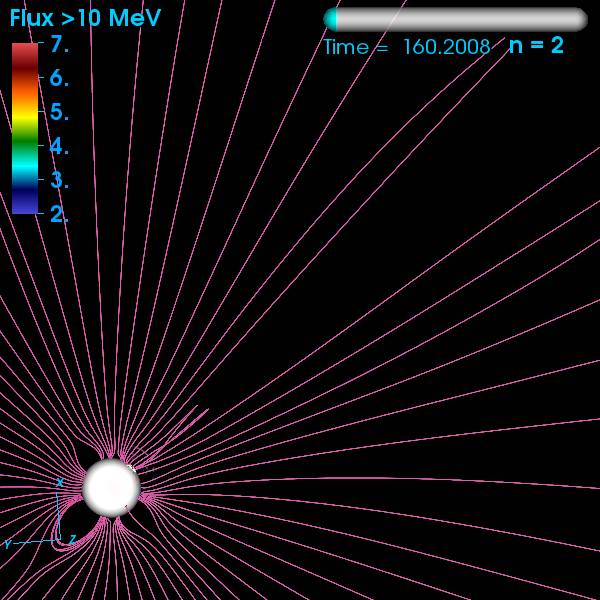
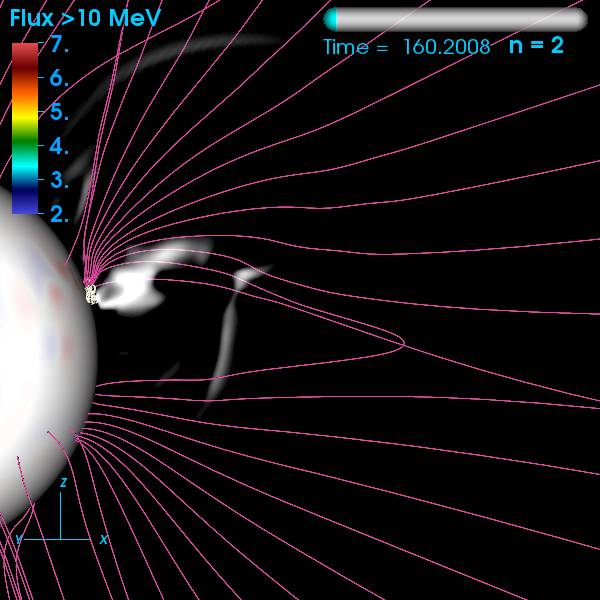
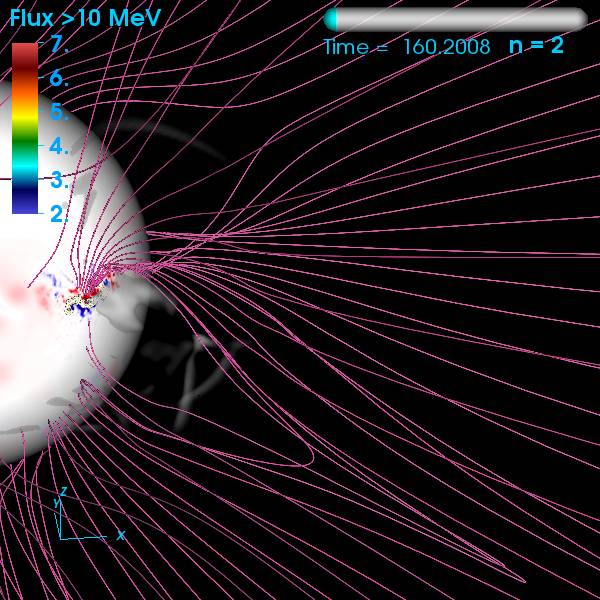
3D views of model particle flux in selected GOES energy bins with magnetic field lines.
back to top3D views of interpolated particle flux in NOAA GOES energy bins (> 10, > 50, or > 100 MeV) predicted by the model, in three planes, together with magnetic field lines showing the simulated CME. The top row shows the fluxes in the heliographic plane, the middle row shows a meridional plane, and the bottom row shows an isometric view of both planes. The leftmost view is to 3 solar radii (Rs), the center view to 20 Rs, and the rightmost view to 1 AU. Use the Energy menu to select the GOES energy bin displayed.


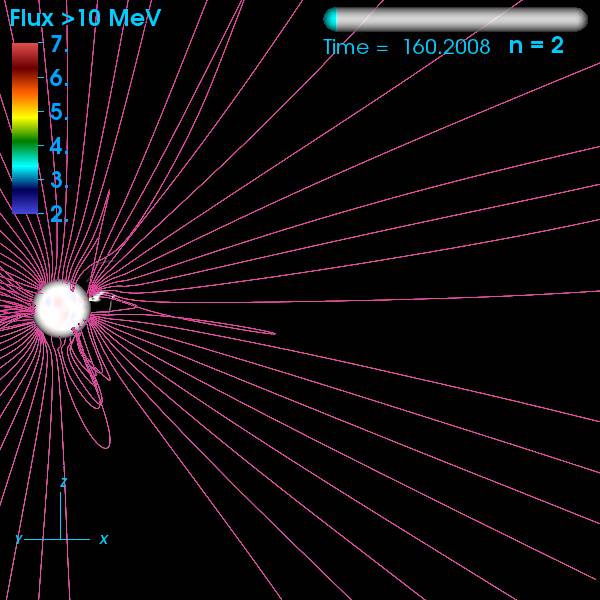
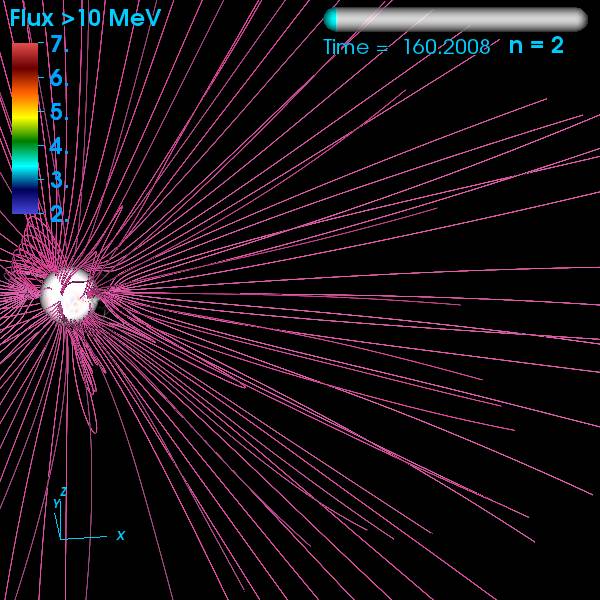
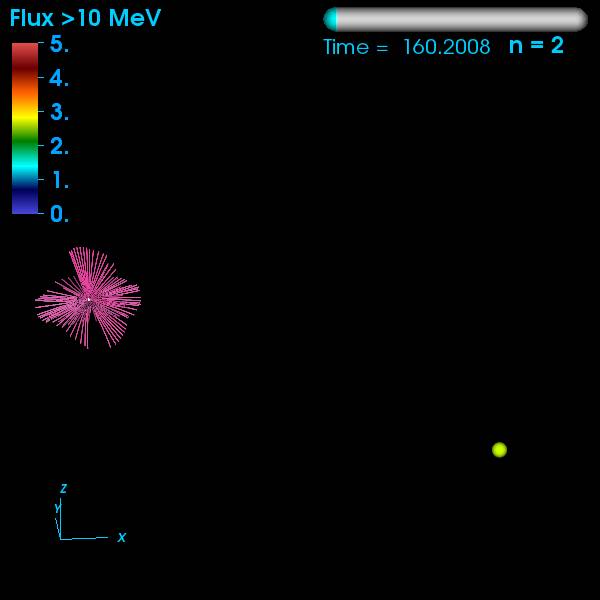
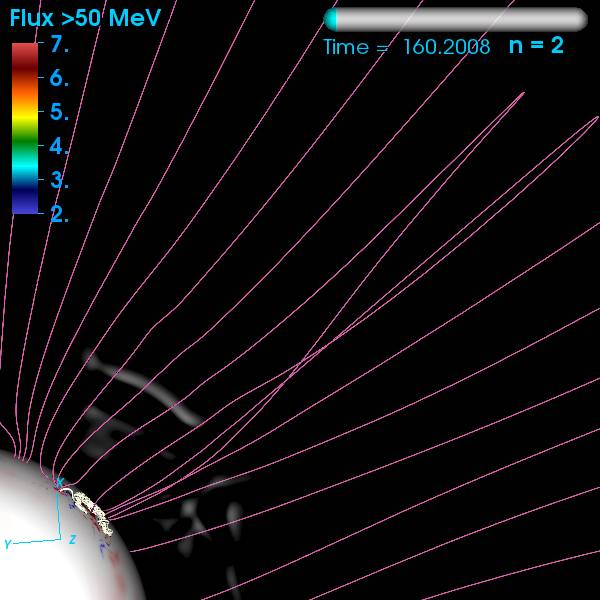
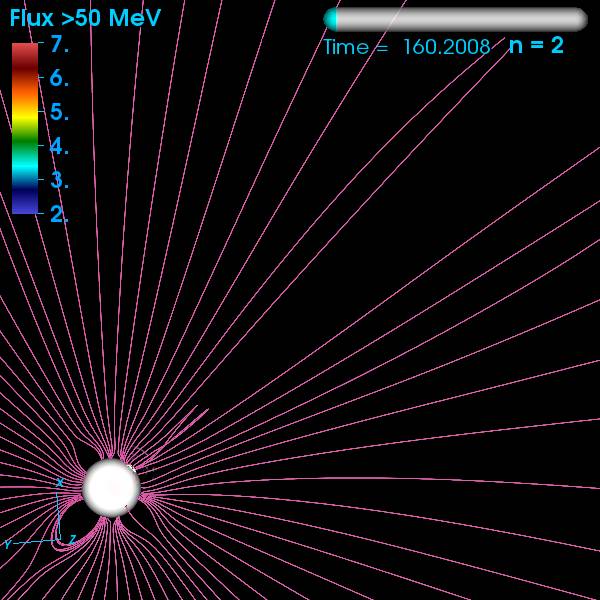
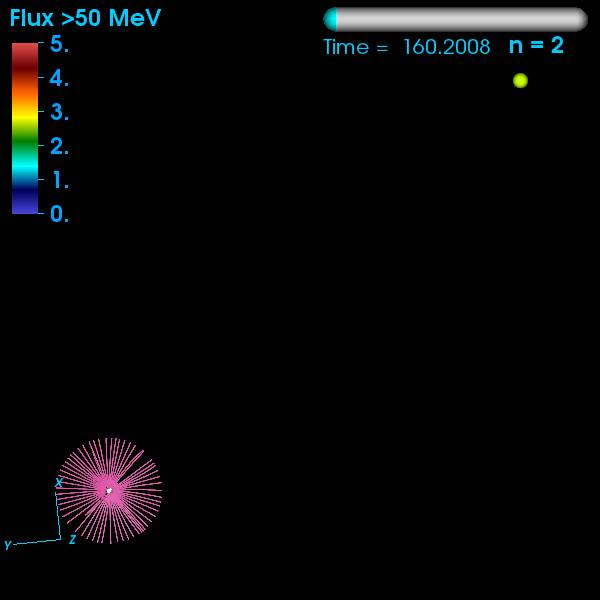
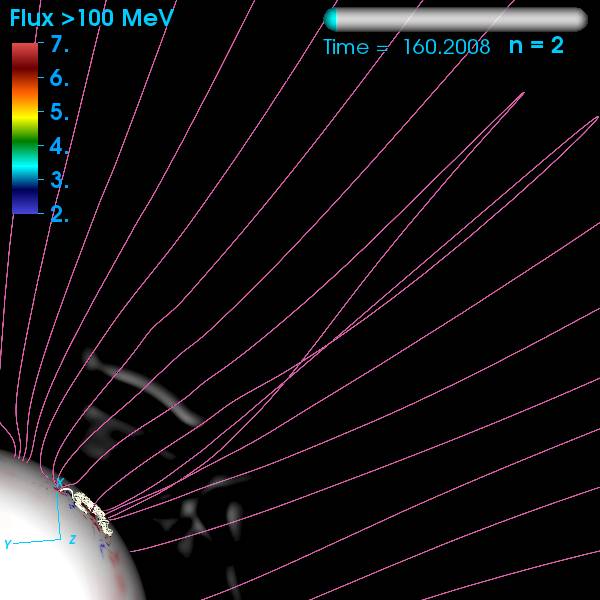
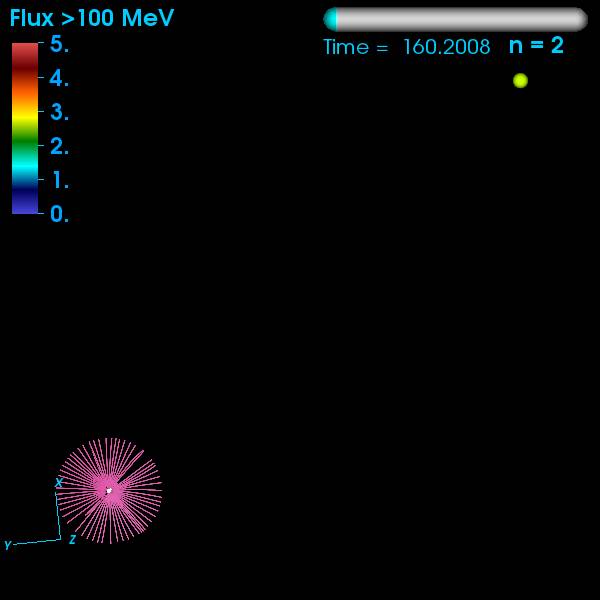
Selected 3D views of model particle flux in GOES energy bins with magnetic field lines.
back to top3D views of interpolated particle flux in NOAA GOES energy bins predicted by the model in selected views, together with magnetic field lines showing the simulated CME. The top row shows the fluxes in the > 10 MeV GOES energy bin, the middle row shows the > 50 MeV bin, and the bottom row shows the > 100 MeV bin. The leftmost view is to 3 solar radii (Rs), the center view to 20 Rs, and the rightmost view to 1 AU. Use the View menu to select the type of plane/view (heliographic, meridional, or isometric) displayed.